Measuring Population Health and Evaluating Health Information Quality
This article explores key metrics for measuring population health status, such as HALE and DALYs, and discusses the critical importance of evaluating health information quality in the digital age. It also covers ethical considerations in clinical decision-making and how data visualization impacts perception.
In the field of public health, data serves as the foundation for everything from local health promotion to global policy interventions. However, simply collecting data is not enough; we must understand how to measure the health of a population, how to evaluate the quality of the information we receive, and how that information influences decision-making in both clinical and public settings. This article explores the metrics used to quantify health, the challenges of navigating modern information landscapes, and the ethical frameworks used in clinical care.
Measuring Population Health Status
To understand the health of a nation or the world, public health professionals use population health status measures—metrics that summarize the health of large groups of people. While simple metrics like infant mortality, life expectancy, and under-5 mortality provide vital snapshots, more complex measures are required to capture the true "burden" of disease.
Health-Adjusted Life Expectancy (HALE)
Life expectancy alone only tells us how long a person lives, not how well they live. HALE improves upon this by adjusting life expectancy for years lived with illness and disability. For example, if a population has a life expectancy of 80 years but a health quality percentage of 90%, the HALE would be calculated as:
HALE=80×0.90=72 healthy years
This metric is essential for policymakers to understand the impact of chronic conditions and aging populations.
Disability-Adjusted Life Years (DALY)
While HALE focuses on "healthy years lived," the Disability-Adjusted Life Year (DALY) is used to measure the overall disease burden. A DALY represents the total "loss" to a population, combining two distinct factors:
Years lost due to premature death.
Years lived with disability.
DALY data is categorized into three main areas: communicable diseases (infectious diseases), noncommunicable diseases (chronic conditions), and injuries. By using DALYs, governments can prioritize resources toward the specific types of diseases that cause the greatest loss of healthy life.
Evaluating the Quality of Health Information
In an era of digital saturation, the ability to distinguish between high-quality data and harmful content is a critical skill. This is closely tied to health literacy, which refers to an individual's ability to find, understand, and use health information to make decisions.
The Spectrum of Information Quality
Not all information is created equal. When evaluating health content, we must distinguish between three problematic types of information:
Incomplete Information: Accurate data that fails to provide the full picture. For example, a headline stating "Sleep Deprivation Increases 25%" might be factually true based on a specific survey, but it may lack the context of previous years or the total population size.
Misinformation: Inaccurate or false information that is believed by the user to be true.
Disinformation: Incorrect information that is intentionally created and spread to encourage specific, often harmful, actions.
Exam Tip: When evaluating a website, look for the author's credentials, the timeliness of the data, whether they cite proper sources, and if the information is presented with a clear explanation of the data.
Clinical Decision-Making and Ethics
Health information is ultimately used to make decisions. In clinical settings, the way information is shared between a provider and a patient involves significant ethical considerations.
There are three primary approaches to decision-making in healthcare:
Inform of Decision: The clinician possesses all essential information and makes the decision based on what they believe is in the patient's best interest.
Informed Consent: This is a critical ethical standard where patients must be provided with the risks, benefits, and alternatives of a treatment. They must fully understand these factors to give their permission before an intervention occurs. This approach is vital for protecting vulnerable populations and providing patient agency.
Shared Decision-Making: This is a collaborative approach. The clinician provides the medical evidence, and the patient provides their personal values and priorities. Together, they reach a decision that aligns with both medical science and the patient's life goals.
Perceptions and Data Visualization
How we perceive health information is often influenced by psychological factors rather than just raw data. Three specific effects can skew our perception of risk:
Dread Effect: We fear hazards that produce highly visual or gruesome consequences (e.g., a shark attack).
Unfamiliarity Effect: We feel more fear toward hazards we have little experience with.
Uncontrollability Effect: We perceive hazards as more threatening if we feel we have no control over them.
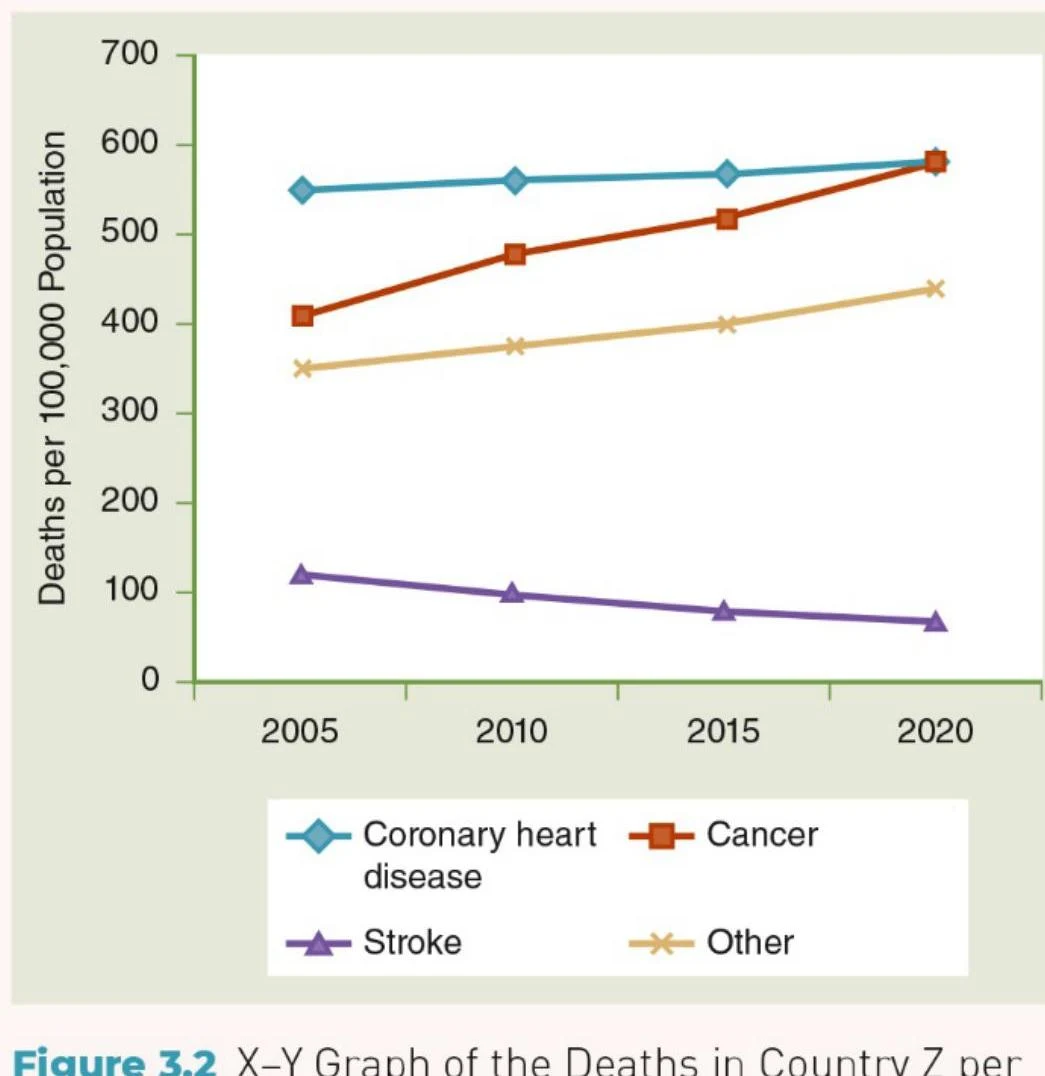
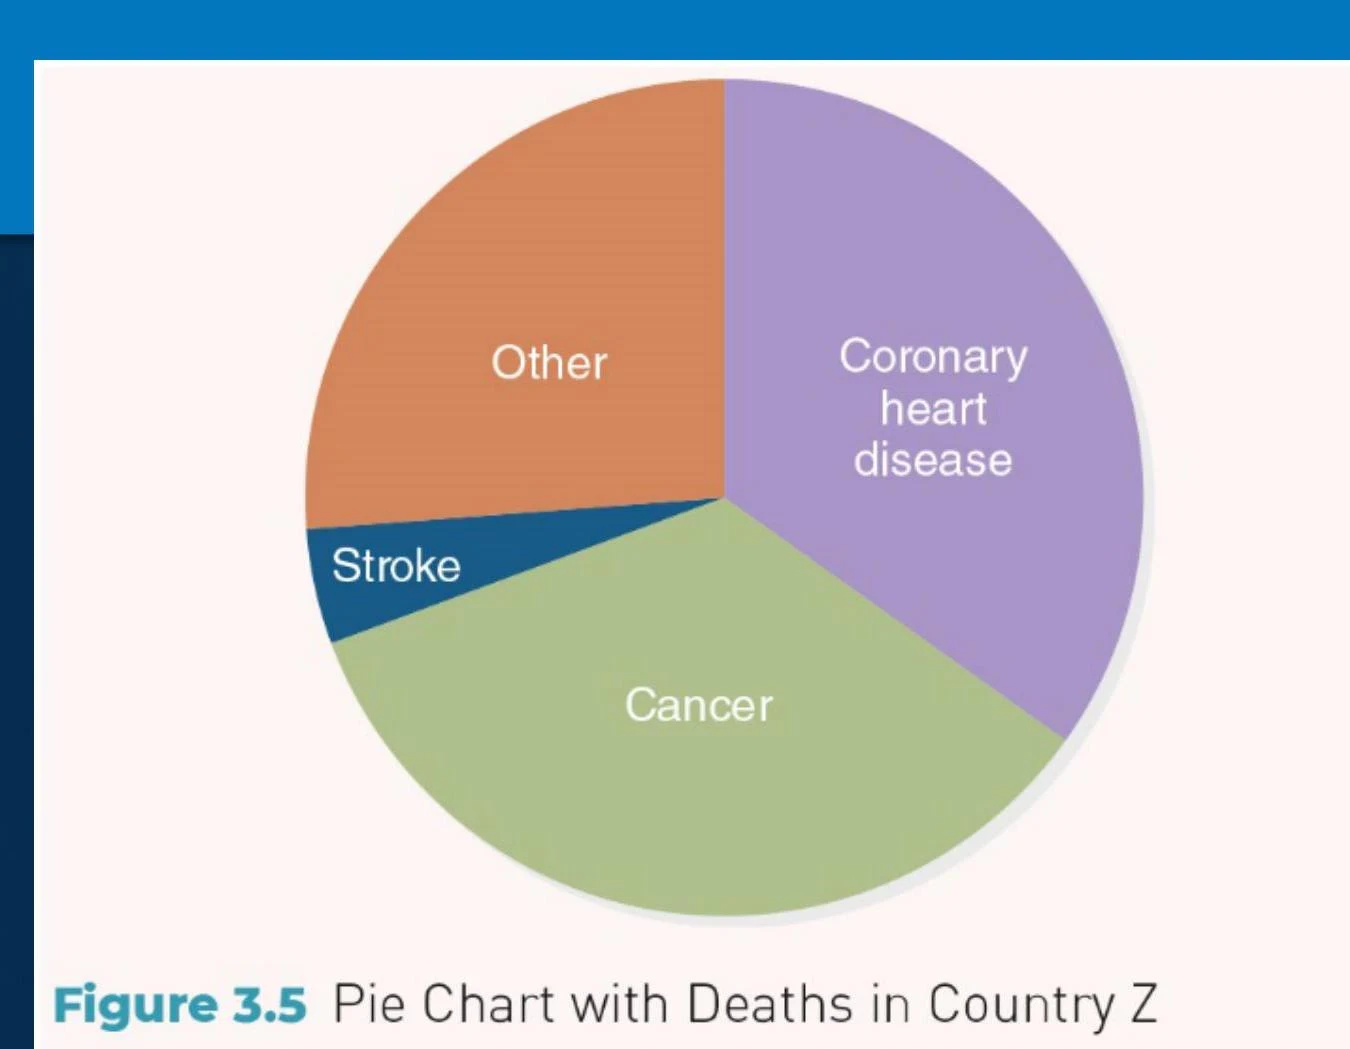
To combat these biases, public health professionals use various graphical methods to display data clearly, such as X-Y graphs, geometric graphics, and pie charts. Effective visualization must always account for the health literacy of the intended audience to ensure the message is understood correctly.
X-Y Graph of the Deaths in Country Z per 100,000 Population from 2005 to 2020 for Coronary Heart Disease, Cancer, Stroke, and Other causes.Figure 3.2 X-Y Graph of the Deaths in Country Z per 100,000 Population.
Bar chart showing deaths per 100,000 population for Coronary heart disease, Cancer, Stroke, and Other causes in the years 2005, 2010, 2015, and 2020.Figure 3.5 Column Chart of Deaths in Country Z per 100,000 Population.
Pie chart illustrating causes of death in Country Z, including Coronary heart disease, Cancer, Stroke, and Other.Figure 3.5 Pie Chart with Deaths in Country Z.
Keep reading for free.
Create an account to finish this reading and make it part of your study routine.