


In the field of statistics, we often deal with large, complex, or rapidly changing systems. Because it is frequently impossible to observe every single member of a group, we use sampling to estimate the characteristics of that group. One of the most fundamental ways to summarize these observations is through descriptive statistics, which provide a concise way to report the "center" or "location" of a data set.
Understanding Central Tendency
Central tendency refers to a single value that attempts to describe a set of data by identifying the central position within that set. It is a key component of univariate statistics—statistics that describe the distribution of a single variable.
When we look for the center of a data series (a sequence of observations), we generally look for three primary measures: the mean, the median, and the mode.
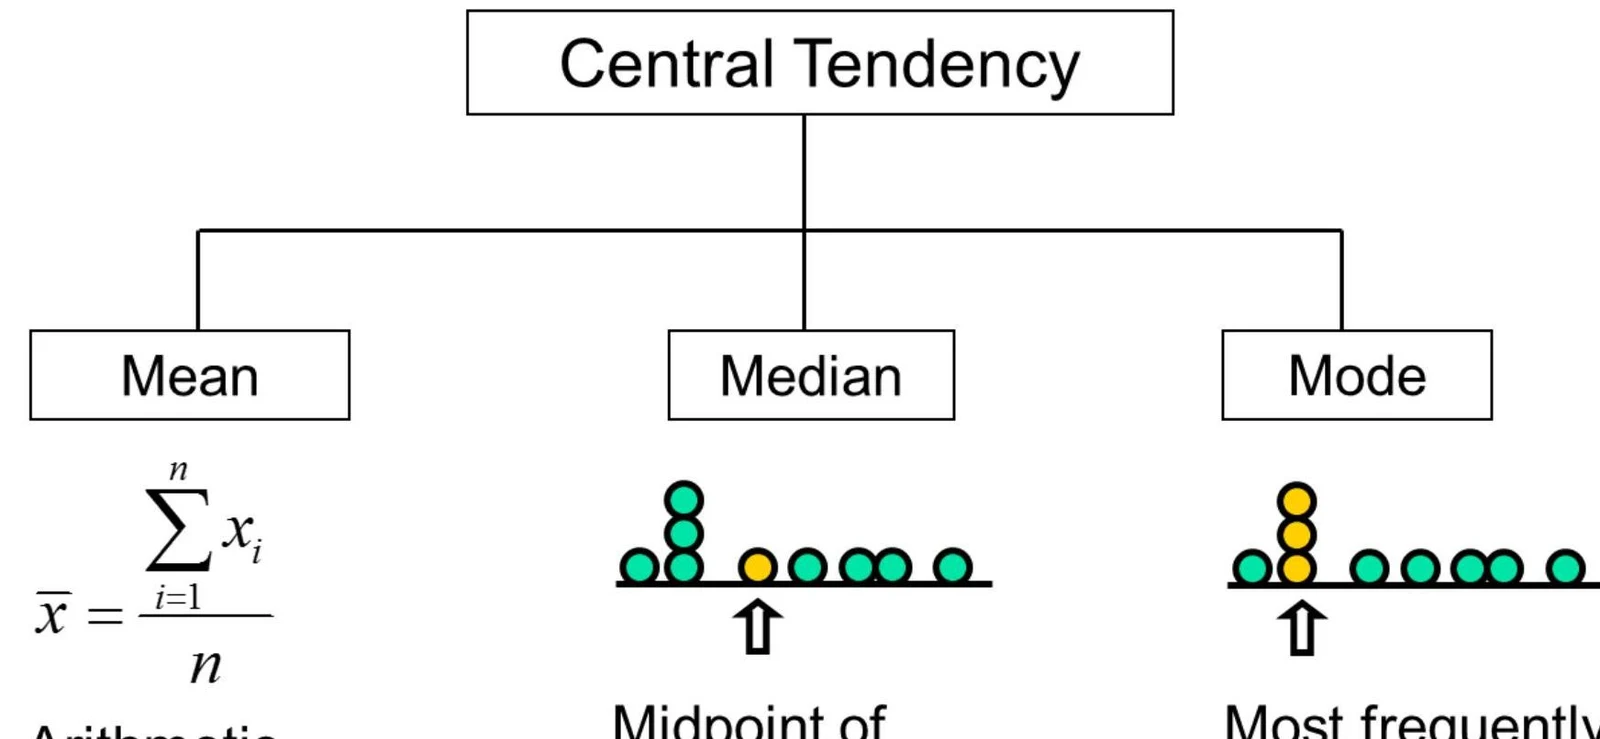
The Arithmetic Mean
The arithmetic mean is the most common measure of central tendency and is often referred to as the "average". It is calculated by adding all the values in a data set and dividing that sum by the total number of observations.
In statistics, we distinguish between whether we are looking at an entire population or just a sample:
Population Mean
When you have data for every single member of the group you are studying (the population), the mean is denoted by the Greek letter .

Keep reading for free.
Create an account to finish this reading and make it part of your study routine.
Continue reading freeAlready have an account? Log in
Updated