


In statistics, we often encounter large and complex datasets that are difficult to interpret in their raw form. To make sense of this information, we use descriptive statistics to summarize the data in an informative way. One of the most fundamental aspects of descriptive statistics is identifying the "center" of a dataset, a concept known as central tendency.
By finding a single value that represents the typical or "expected" value of a data series, we can provide a concise summary of where the data tends to cluster.
Population vs. Sample
Before calculating measures of central tendency, it is crucial to distinguish between a population and a sample.
- Population: The entire set of units of interest (for example, every high school student at a specific school). Numerical descriptors for a population are called parameters.
- Sample: A subset of the population used when the full population cannot be observed. Numerical descriptors calculated from a sample are called statistics.

Measures of Central Tendency
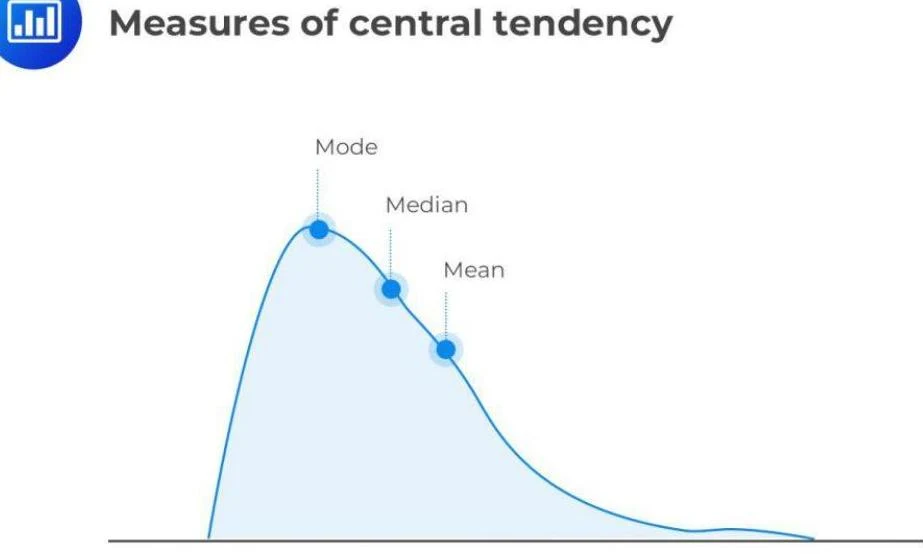
There are three primary measures used to describe the location of the center in a univariate data distribution: the arithmetic mean, the median, and the mode.
The Arithmetic Mean
The arithmetic mean (often simply called the "average") is the most common measure of central tendency. It is calculated by adding all the values in a series and dividing by the total number of observations. It is often viewed as the "best guess" or expected value for a data series.
Keep reading for free.
Create an account to finish this reading and make it part of your study routine.
Continue reading freeAlready have an account? Log in
Updated