An examination of key macroeconomic indicators including GDP, inflation, public debt, and productivity. It compares economic growth drivers in major economies like the US and China, explaining concepts such as PPP GDP, per person GDP, and the distinction between extensive and intensive growth.
Understanding the trajectory of global economies requires more than just looking at a single number like Gross Domestic Product (GDP). To truly grasp the health and future potential of a nation, economists analyze a complex web of interconnected variables: output, inflation, debt levels, and the underlying engine of growth—productivity. By comparing major powers like the United States and China, we can observe how different drivers, such as population shifts and technological advancement, shape the global economic landscape.
Measuring Economic Output and Living Standards
At the most basic level, we measure the size of an economy through its total output, often expressed as GDP. However, total GDP can be misleading when comparing countries of different sizes. To understand the actual standard of living, we must look at per person GDP (or GDP per capita).
When comparing nations, economists often use Purchasing Power Parity (PPP) GDP. Unlike nominal exchange rates, PPP adjusts for the differences in the cost of living and the purchasing power of local currencies, providing a more accurate comparison of what people can actually buy with their income.
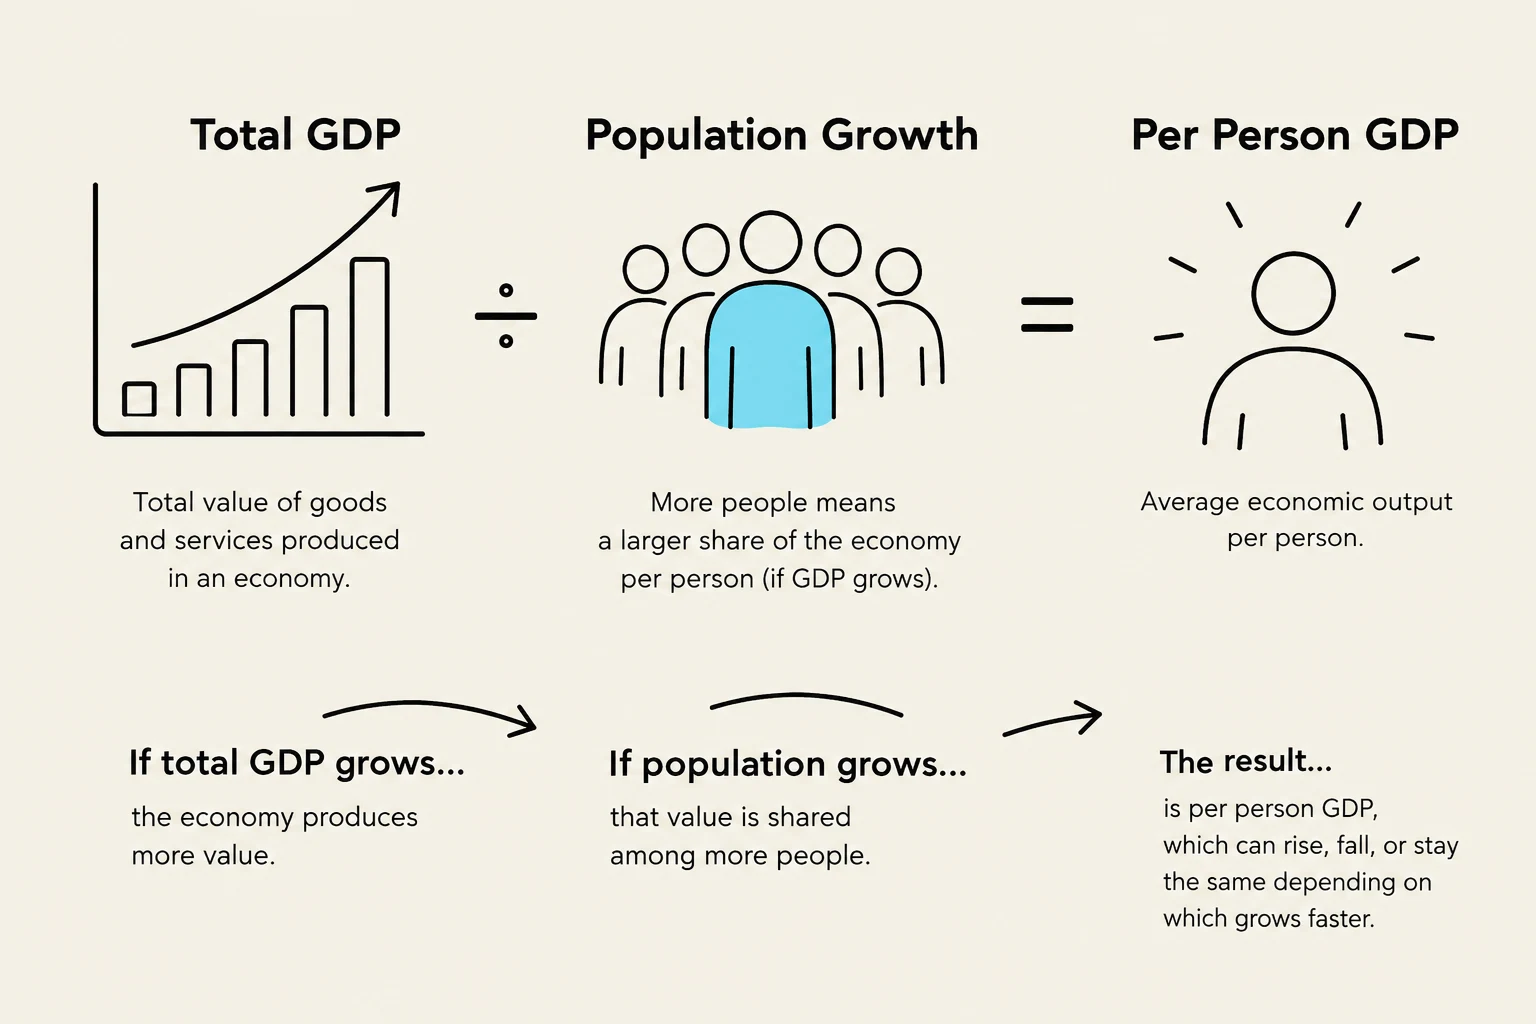
Consider the distinction between total growth and individual prosperity. If a country's GDP grows by 5% because its population grew by 5%, the average person is no better off than they were the year before. True economic progress occurs when growth outpaces population growth.
This diagram illustrates the relationship between Total GDP, Population Growth, and Per Person GDP, explaining how changes in total economic output and population size affect the average economic output per individual.
Worked Example: The Population Trap
Assume China has a PPP GDP of $21 trillion and a population that results in a per person GDP of $14,720. If the economy grows at 5% per year for 10 years, but that growth is driven entirely by population growth, the total GDP will increase significantly, but the per person GDP will remain stagnant at $14,720. Conversely, if that 5% growth is driven by productivity, the per person GDP will rise substantially.
Inflation and the Volatility of Output
Economic growth is rarely a smooth upward line. The United States, for instance, has experienced significant fluctuations in output due to various shocks. A notable example was the sharp drop in US output during the second quarter of 2020, which was largely driven by government-mandated lockdowns during the COVID-19 pandemic.
These shocks often trigger shifts in inflation—the rate at which the general level of prices for goods and services rises. While the acute phase of the pandemic was initially associated with lower inflation due to suppressed demand, subsequent years (2021 and 2022) saw much higher inflation rates. Economists debate the exact causes, weighing factors such as supply chain disruptions against the impact of low interest rates during the pandemic years.
This diagram illustrates a negative economic feedback loop, starting with an economic shock like a lockdown, leading to a drop in output, lower incomes, reduced spending, falling investment, higher unemployment, weaker demand, and ultimately slower economic growth.
The Burden of Public Debt
As governments respond to crises—whether through stimulus packages to boost output or social safety nets during recessions—they often borrow money, leading to an increase in the public debt to GDP ratio.
There is significant debate among economists regarding these ratios:
The Urgent View: Some argue that high debt ratios must be addressed immediately to prevent long-term instability and to ensure the government can meet future obligations.
The Measured View: Others suggest that while reducing debt is a desirable long-term goal, it may not be an urgent necessity, especially if the debt is used to fund productive investments or if interest rates remain manageable.
The Engine of Growth: Productivity
If population growth provides the "quantity" of labor, productivity provides the "quality." Productivity is the primary driver of long-term increases in per person GDP. A key metric used to measure this is output per hour worked.
When workers can produce more goods and services in the same amount of time—often due to better technology, improved education, or more efficient processes—the entire economy becomes more prosperous. In the United States, the rate of growth in output per person has been a central focus of economic study, particularly as researchers look for trends across different decades.
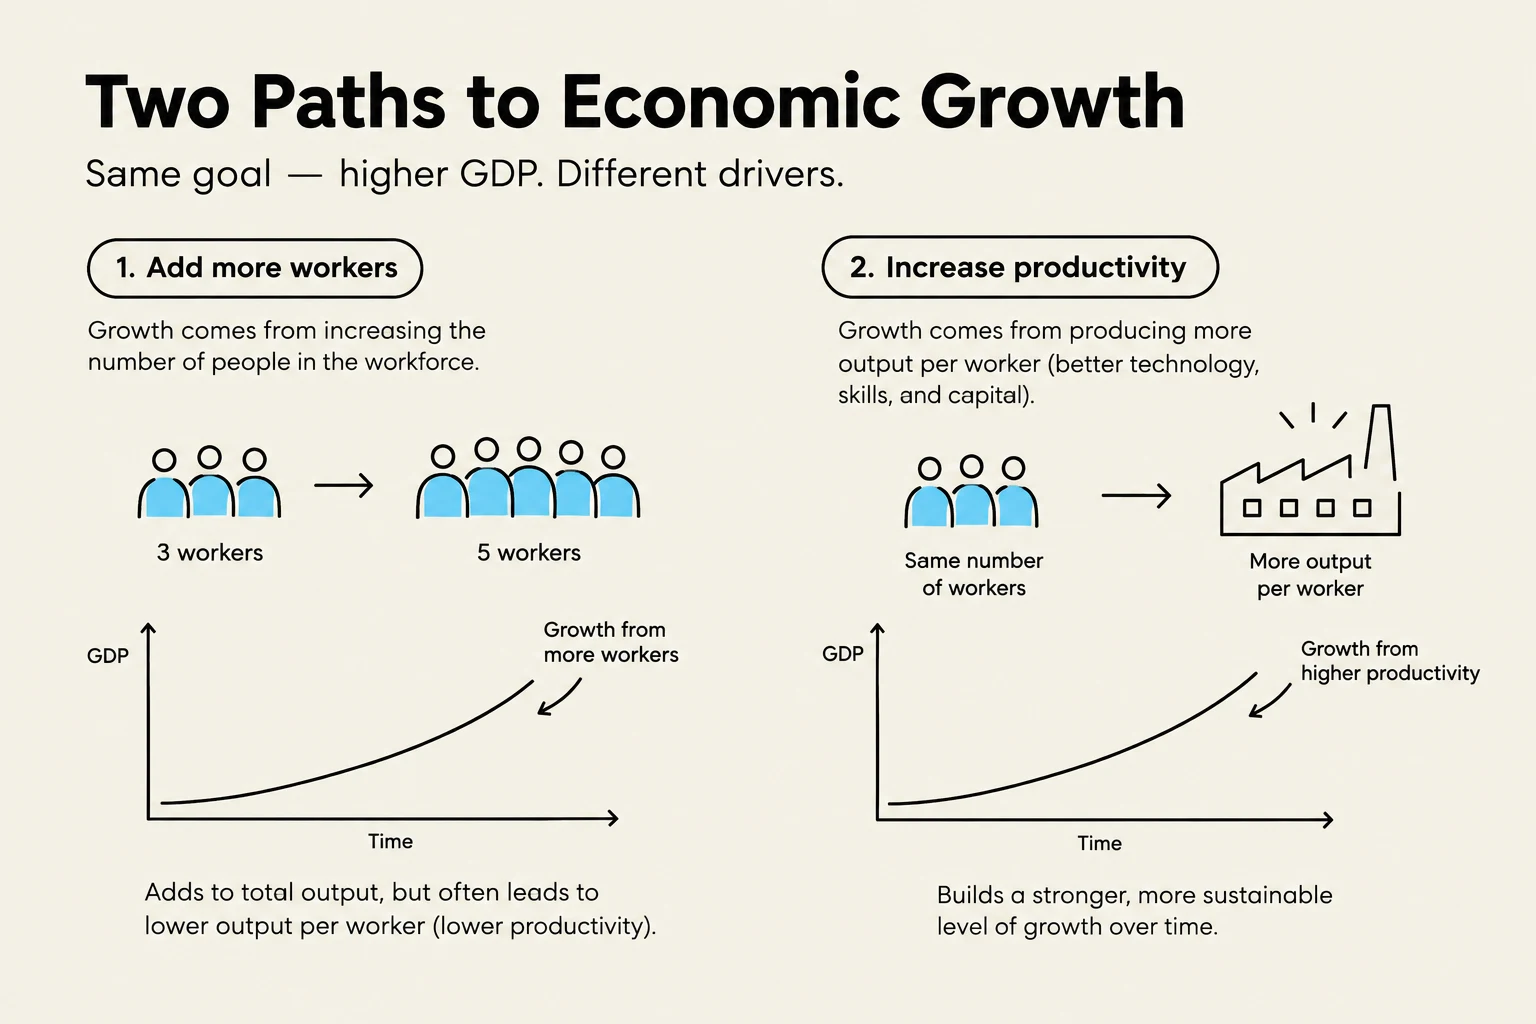
This illustration depicts two paths to economic growth: increasing the workforce or increasing productivity. The first path shows GDP growth from adding more workers, which can lead to lower output per worker. The second path illustrates GDP growth from increased productivity with the same number of workers, leading to stronger, more sustainable growth.
Study Tip: Distinguishing Growth Types
When analyzing a country's power on the world stage, always ask: Is this growth extensive or intensive?
Extensive growth (driven by population) increases the size of the market and the total workforce.
Intensive growth (driven by productivity) increases the wealth and efficiency of each individual, which is generally considered a more sustainable path to global influence.
Keep reading for free.
Create an account to finish this reading and make it part of your study routine.