Job Analysis and Compensation: Determining Fair Pay
This guide explains the process of job analysis and job evaluation to establish fair and competitive compensation systems. It covers compensable factors, job descriptions, job specifications, and the use of regression analysis to create a market line for pay structures.
When an organization decides how much to pay an employee, it cannot simply pick a number out of thin air. To build a sustainable and fair compensation system, a company must first understand exactly what a job entails and then determine its relative value to the organization. This process moves from the granular details of a job's tasks to a high-level mathematical model that ensures pay is both internally equitable and externally competitive.
The Foundation: Job Analysis
Before you can determine what a job is worth, you must perform a Job Analysis. This is the systematic study of a job to determine the specific tasks, responsibilities, and the personal qualifications (often referred to as KSA's: Knowledge, Skills, and Abilities) necessary to perform it.
During job analysis, HR professionals collect information through questionnaires and salary data, often utilizing resources like O*NET or the Bureau of Labor Statistics (BLS). The output of this process is two-fold: a Job Description (what the job does) and a Job Specification (what the person needs to have).
Evaluating Job Worth through Compensable Factors
Once the job is analyzed, the next step is Job Evaluation, which determines the value of various jobs within the company. To do this objectively, organizations use "compensable factors"—the specific criteria that the company is willing to pay for.
While different companies may use different criteria, most rely on a set of Universal Compensable Factors to review the worth of a job. These factors allow a company to compare a janitor to an accountant using a standardized scoring system.
The Four Universal Factors
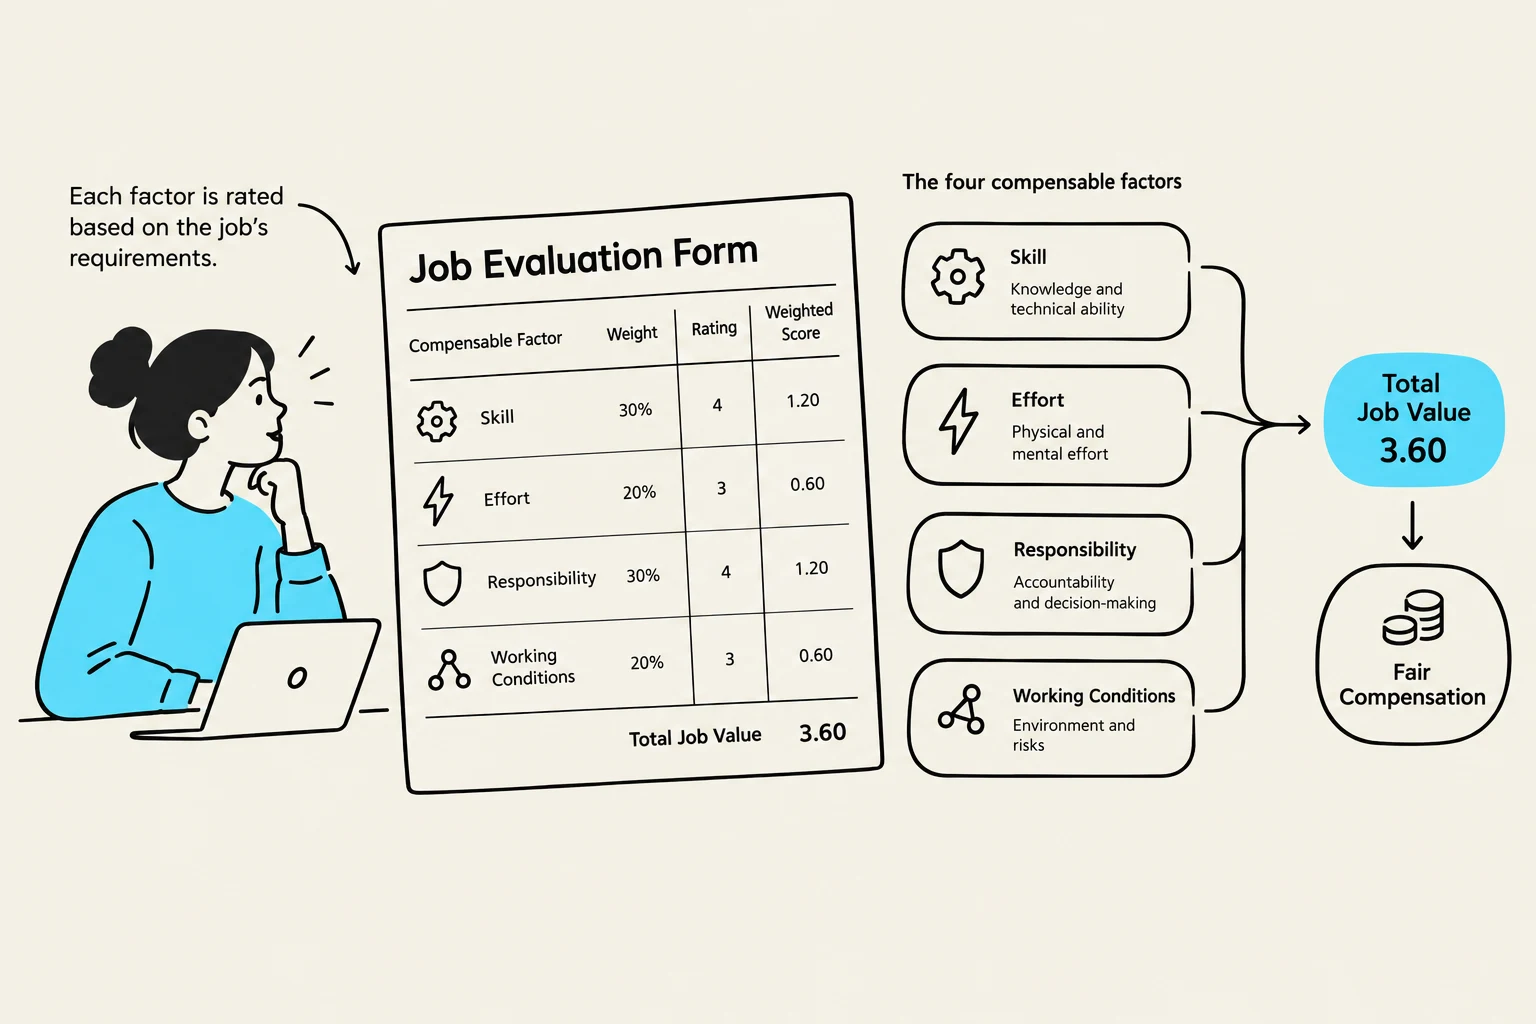
Skill: This measures the level of expertise required. It can include mental experience, technical knowledge, or the number of different certifications an employee holds.
Effort: This assesses the amount of energy required to perform the job, categorized into physical effort (manual labor) and mental effort (concentration and cognitive load).
Responsibility: This looks at the consequences of the job. It includes the "effect of error"—how much damage occurs if a mistake is made—and the level of decision-making or innovation required.
Working Conditions: This accounts for the environment. Jobs that involve environmental hazards, extreme temperatures, or high-risk settings (like power line repair) typically receive higher scores in this category.
Exam Tip: When using a Job Evaluation Form, remember that factors are often "weighted." For example, a technical role might weight "Skill" at 40% of the total score, while "Working Conditions" might only account for 10%.
This illustration explains the job evaluation process, detailing how compensable factors like skill, effort, responsibility, and working conditions are weighted and scored to determine a total job value, which then leads to fair compensation.
Quantifying Value: The Job Evaluation Form
To turn these abstract factors into a number, organizations use a Job Evaluation Form. In this form, each factor is assigned a "degree" (e.g., 1 through 5) and a "weight" (the percentage of importance that factor holds for that specific job).
For example, if an administrative job requires high mental skill but very little physical effort, the "Skill" factor might be weighted heavily, while "Effort" is weighted lightly. By multiplying the degree by the weight, the organization arrives at a total "Job Point" score.
Mapping Pay to Worth: Regression and the Market Line
Once you have assigned "Job Points" to every position in your company, you need to connect those points to actual dollars. This is where mathematical modeling becomes essential to ensure Internal Equity (employees feel they are paid fairly compared to their peers) and External Equity (employees are paid fairly compared to the outside market).
The Regression Line
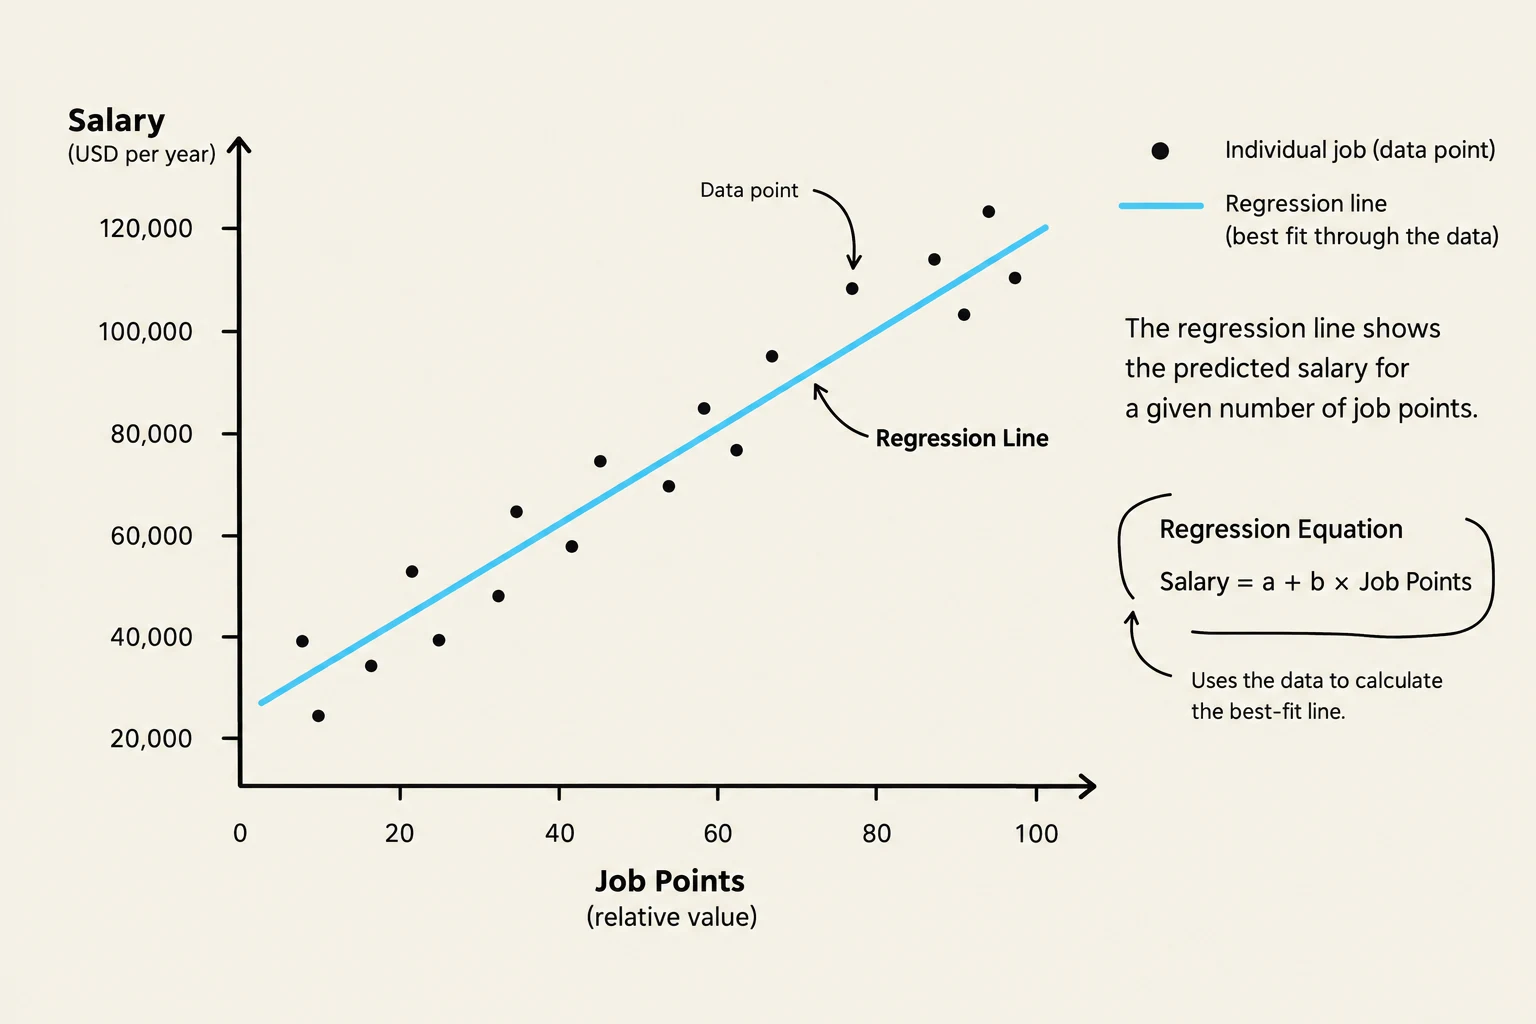
To visualize this relationship, compensation analysts plot their data on a graph where the X-axis represents the Job Points (the internal worth) and the Y-axis represents the Salary (the market rate). By applying a Linear Regression equation, the company can calculate a "trend line" that represents the ideal relationship between job complexity and pay.
The equation for this line is expressed as:
y=a+bx
Where:
y is the predicted salary.
a is the y-intercept.
b is the slope (how much salary increases for every additional job point).
x is the job points score.
This graph illustrates a regression analysis showing the relationship between job points and salary. The regression line represents the predicted salary for a given number of job points, calculated using the regression equation.
The Market Line
The resulting regression line is often referred to as the Market Line. This line serves as a roadmap for the organization's pay structure. If a job's actual salary is significantly below the market line, the company may be at risk of losing talent to competitors. If it is significantly above, the company may be overpaying for the level of responsibility provided.
By using these tools—job analysis, compensable factors, and regression modeling—organizations can move away from guesswork and toward a scientific, defensible, and fair compensation system.
Keep reading for free.
Create an account to finish this reading and make it part of your study routine.