This guide introduces the fundamental concepts and methods used in psychological research, including variables, operationalization, reliability, validity, and different research designs like descriptive, correlational, and experimental methods.
Psychology is more than just intuition or "common sense." Because humans are prone to various cognitive biases, the field relies on a structured, scientific process to understand the causes of mental processes and behavior. This process involves moving from a theoretical phenomenon to a research question, designing a study, collecting data, and ultimately mobilizing that knowledge to understand the world. To do this effectively, researchers must master the art of measuring variables, ensuring their tools are accurate, and choosing the right method to answer their questions.
The Building Blocks: Variables and Operationalization
At the heart of psychological research are variables—constructs such as behaviors or mental states that can vary across people, situations, or time. For example, "number of drinks consumed" or "anxiety levels" are variables because they are not the same for everyone.
Researchers generally work with two types of variables:
Measured Variables: These are variables whose levels are simply observed or recorded, such as counting how many times a person smiles.
Manipulated Variables: These are variables that the researcher actively controls, such as assigning one group of participants to receive a medication and another to receive a placebo.
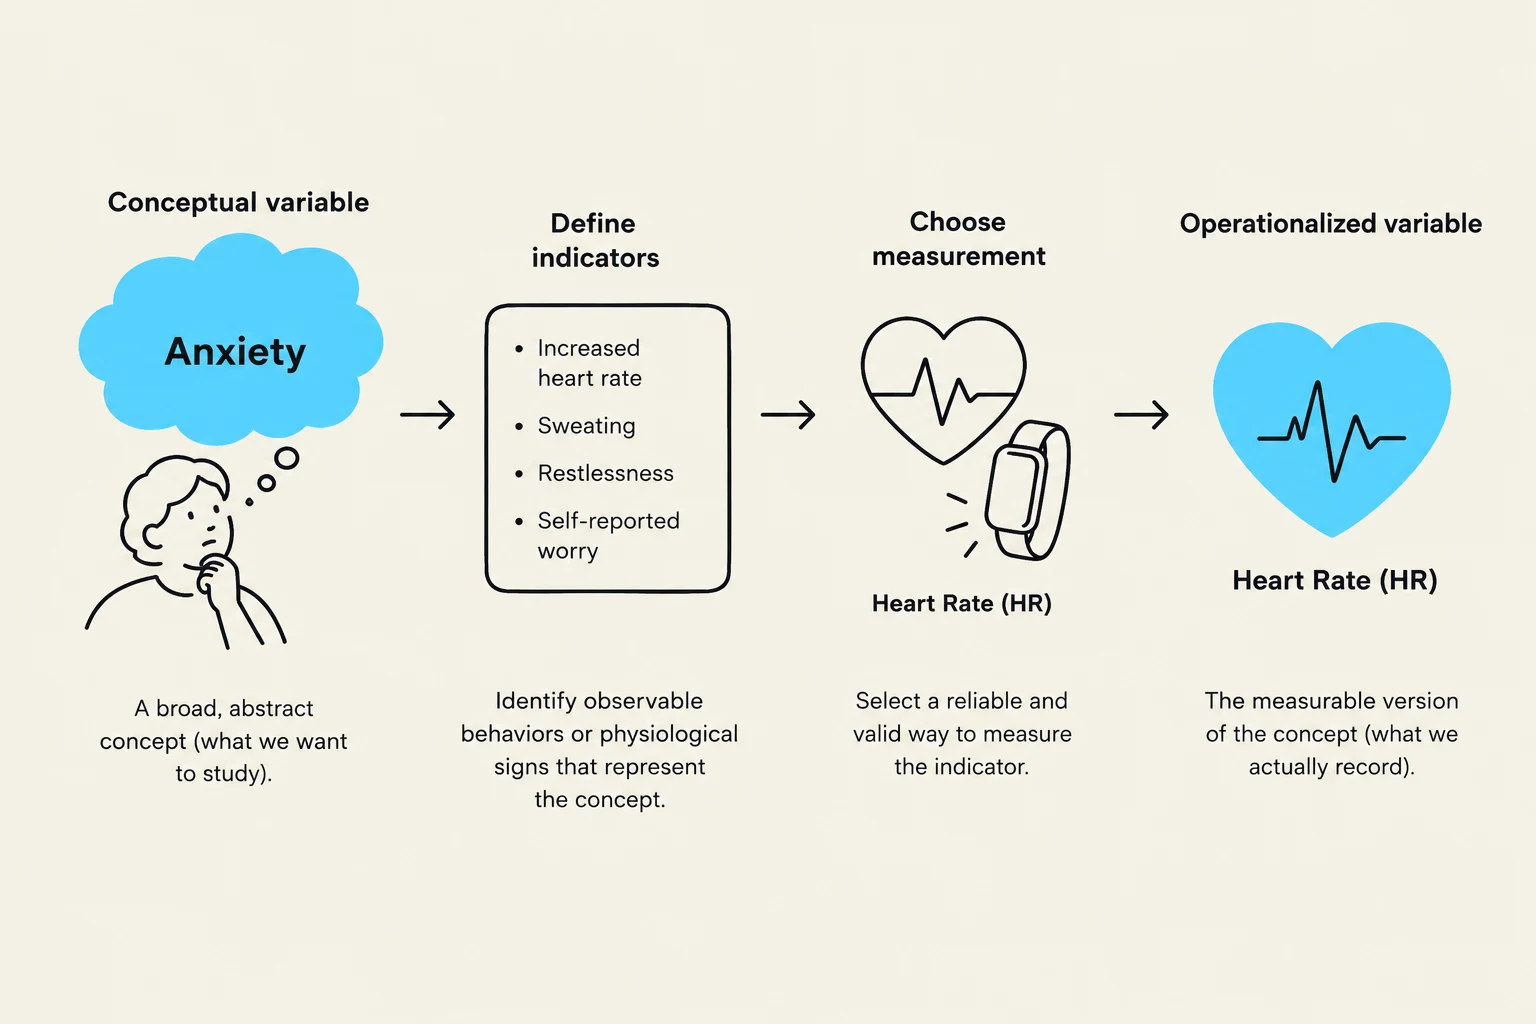
However, psychological concepts like "anxiety" or "intelligence" are abstract. You cannot "see" anxiety directly. To study them, researchers must undergo operationalization—the process of turning a conceptual variable into a quantifiable, measurable, or manipulatable variable.
Exam Tip: If a question asks how a researcher "measures" a concept like happiness, they are asking for the operational definition (e.g., a score on a specific survey or the frequency of smiles).
This diagram illustrates the process of operationalizing a conceptual variable, using anxiety and heart rate as an example. It shows how a broad concept is defined by indicators, measured, and then becomes an operationalized variable.
Ensuring Quality: Objectivity, Reliability, and Validity
Once a variable is operationalized, the researcher must ensure the measurement is high quality. This is assessed through three main lenses: objectivity, reliability, and validity.
Objectivity
An objective measure is one that remains consistent across different instruments and different observers, within a reasonable margin of error. In psychology, this is often achieved through physiological measures, third-party observations, or standardized self-reports.
Reliability
Reliability refers to the consistency and stability of a measure. If a tool is reliable, it should yield similar results under similar conditions. There are two primary ways to check this:
Test-retest reliability: Does the person get the same score today as they do tomorrow?
Internal consistency: Do the different items within a single test all point toward the same concept? For example, if a survey asks about nervousness in social settings, the answers to "feeling nervous at parties" and "feeling nervous on the phone" should converge.
Validity
While reliability is about consistency, validity is about accuracy—the degree to which an instrument actually measures what it claims to measure. This is particularly challenging in psychology. A key component is construct validity, which asks if the operationalization truly represents the abstract concept of interest.
Construct validity is often evaluated through two sub-types:
Convergent validity: Does your measure correlate with other measures of the same concept?
Discriminant validity: Is your measure distinct from measures of unrelated concepts?
Research Methods: From Description to Causation
Psychologists choose different methods depending on whether they want to describe, predict, or explain behavior.
1. Descriptive Methods
The primary goal here is to describe a phenomenon.
Case Study: An in-depth study of a single individual. While rich in detail, these can lead to overgeneralization.
Naturalistic Observation: Recording behavior in its natural environment without any manipulation or control.
Survey: Gathering information about many people's thoughts or behaviors through self-reports.
2. Correlational Methods
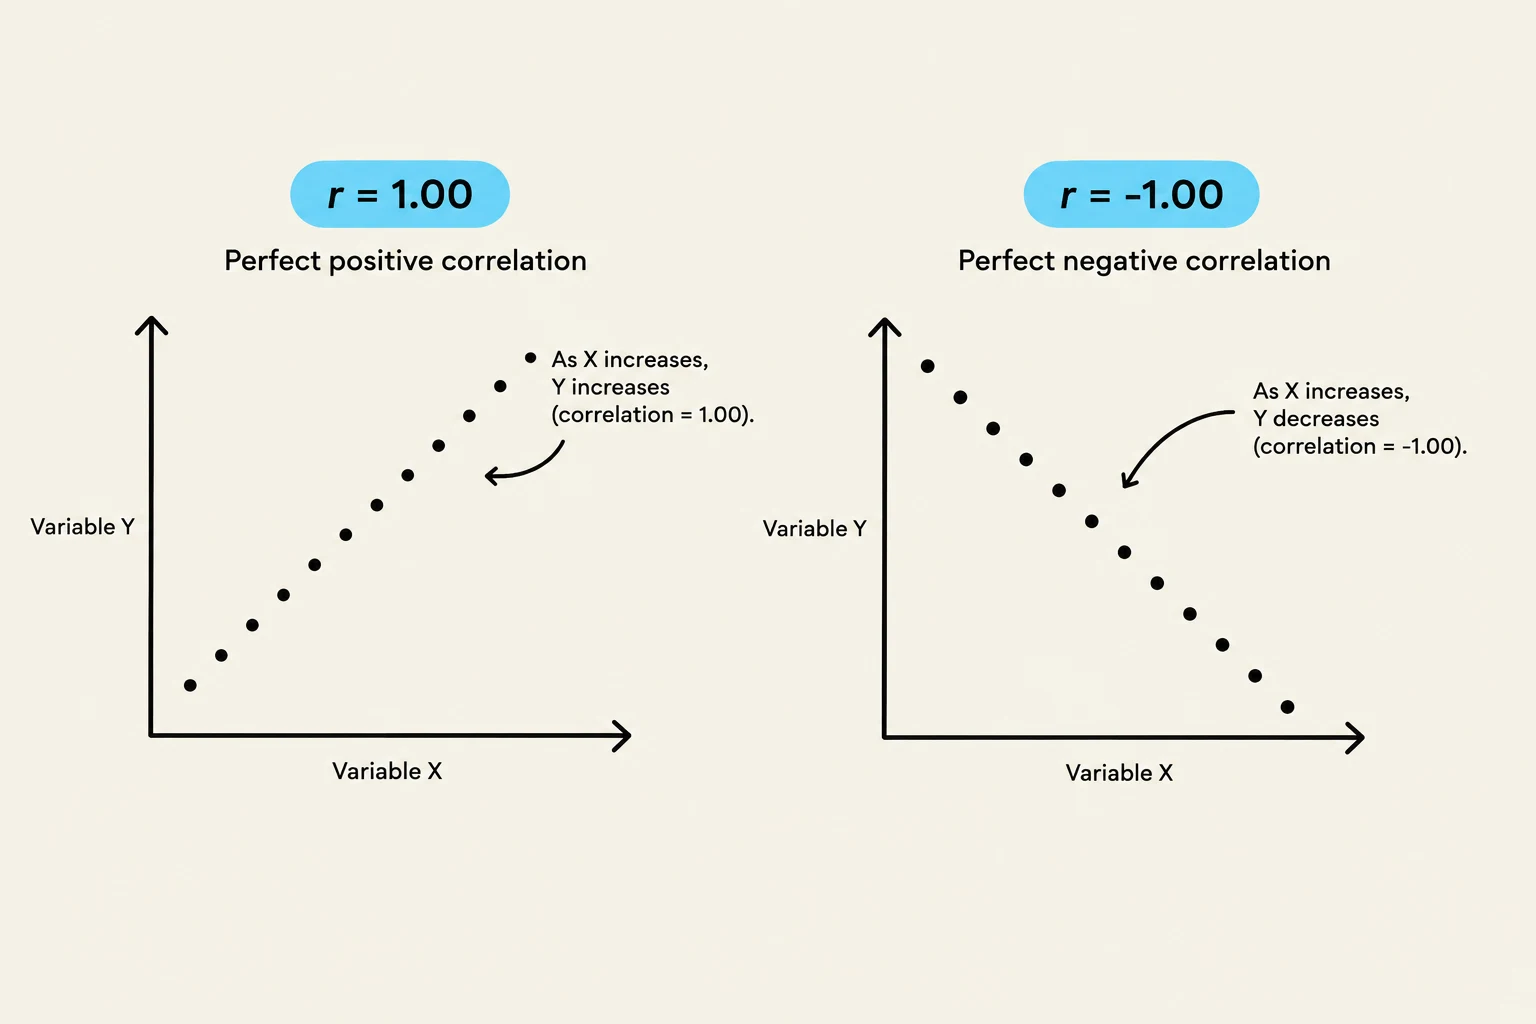
Correlational research looks for an association between two variables—the extent to which they co-occur. This is expressed via a correlation coefficient (r), which ranges from −1.00 to +1.00.
Positive Correlation: Both variables increase or decrease together (e.g., more study time, higher grades).
Negative Correlation: As one variable increases, the other decreases (e.g., more alcohol consumption, lower driving ability).
This illustration shows two scatter plots representing perfect positive and perfect negative correlations between two variables, X and Y, with correlation coefficients of 1.00 and -1.00 respectively.
Crucial Warning:Correlation is NOT causation. Just because two things happen together does not mean one causes the other. A third, unmeasured variable might be causing both.
3. Experimental Methods
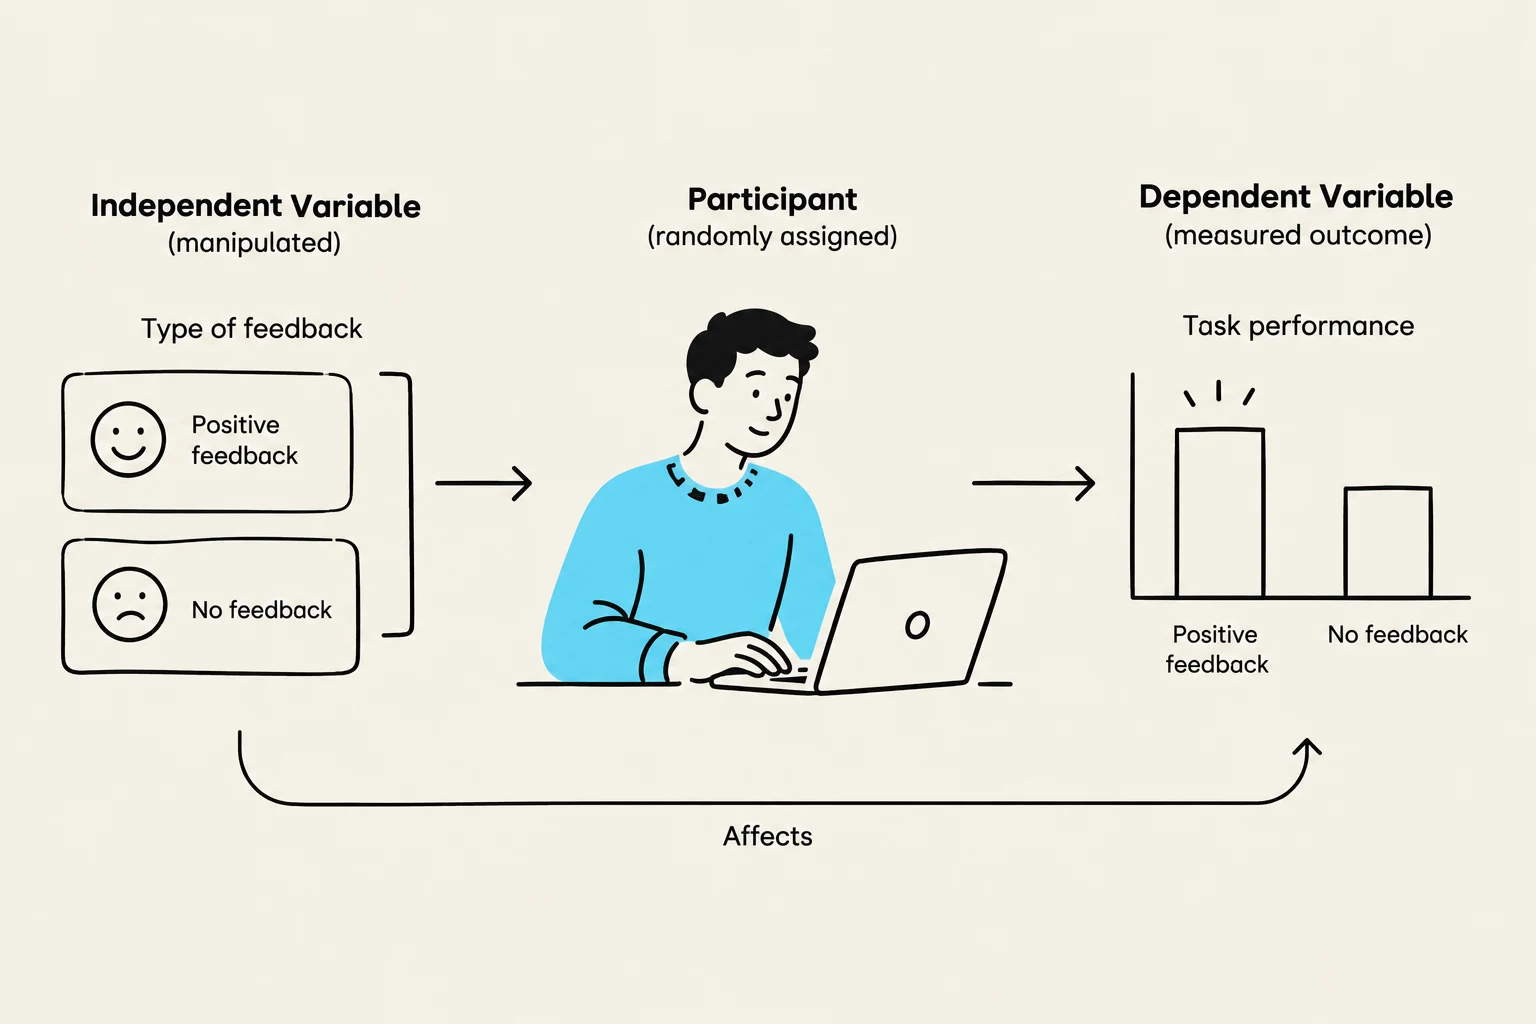
To determine causation, researchers must use experiments. In an experiment, the researcher manipulates an Independent Variable (IV) to see if it causes a change in a Dependent Variable (DV).
To ensure the results are actually caused by the IV, researchers must control for confounding variables—external factors that provide alternative explanations for the results. They do this through:
Random Assignment: Assigning participants to groups (experimental vs. control) by chance to ensure the groups are, on average, identical before the manipulation.
Standardizing Procedures: Keeping the environment and instructions the same for everyone.
This diagram illustrates a basic experimental design, showing how an independent variable (type of feedback) is manipulated to observe its effect on a participant's task performance, which serves as the dependent variable.
Interpreting the Data: Significance and Effect Size
Once data is collected, researchers ask two final questions:
1. Is the finding statistically significant?
Using Null Hypothesis Significance Testing (NHST), researchers start with the assumption that there is no effect in the population (the "null hypothesis"). If the probability of getting the observed results by pure chance is less than 5% (a standard threshold), the result is deemed "statistically significant".
2. Is the finding meaningful?
A result can be statistically significant but practically useless. This is where effect size comes in. While significance tells us if an effect exists, effect size tells us how much the independent variable actually influences the dependent variable.
For example, a new therapy might significantly reduce alcohol consumption, but if it only reduces it by 0.1 drinks per day, the effect size is too small to be considered clinically meaningful.
Keep reading for free.
Create an account to finish this reading and make it part of your study routine.