Introduction to Observational Study Designs in Epidemiology
This article provides an overview of fundamental observational study designs used in epidemiology, including cohort, case-control, and cross-sectional studies. It explains their methodologies, measures of association like relative risk and odds ratio, and potential biases.
Epidemiology is the study of how health-related states or events are distributed in populations and how they can be controlled. While experimental studies like randomized clinical trials are powerful, much of our understanding of disease comes from observational epidemiology. In these studies, investigators do not assign exposures; instead, they observe individuals and record their exposures and outcomes to assess associations between suspected risk factors and health events.
This article reviews the primary nonexperimental study designs that use individuals as the unit of observation: cohort, case-control, and cross-sectional studies.
The Cohort Study
A cohort study follows a group of individuals over time to see how their exposures relate to the development of a disease. This design is particularly useful for establishing a temporal sequence—showing that the exposure occurred before the disease.
Prospective and Nonconcurrent Cohort Studies
A prospective study begins with a group of people who are currently free of the disease of interest. They are classified by their exposure status and followed into the future to observe the incidence of new cases.
In contrast, a nonconcurrent cohort study (often called a historical cohort study) uses existing records to identify a group of people who were exposed to a certain factor at a specific point in the past. The investigator then "follows" them through historical records up to the present day to see who developed the outcome.
Measures of Association: Relative Risk
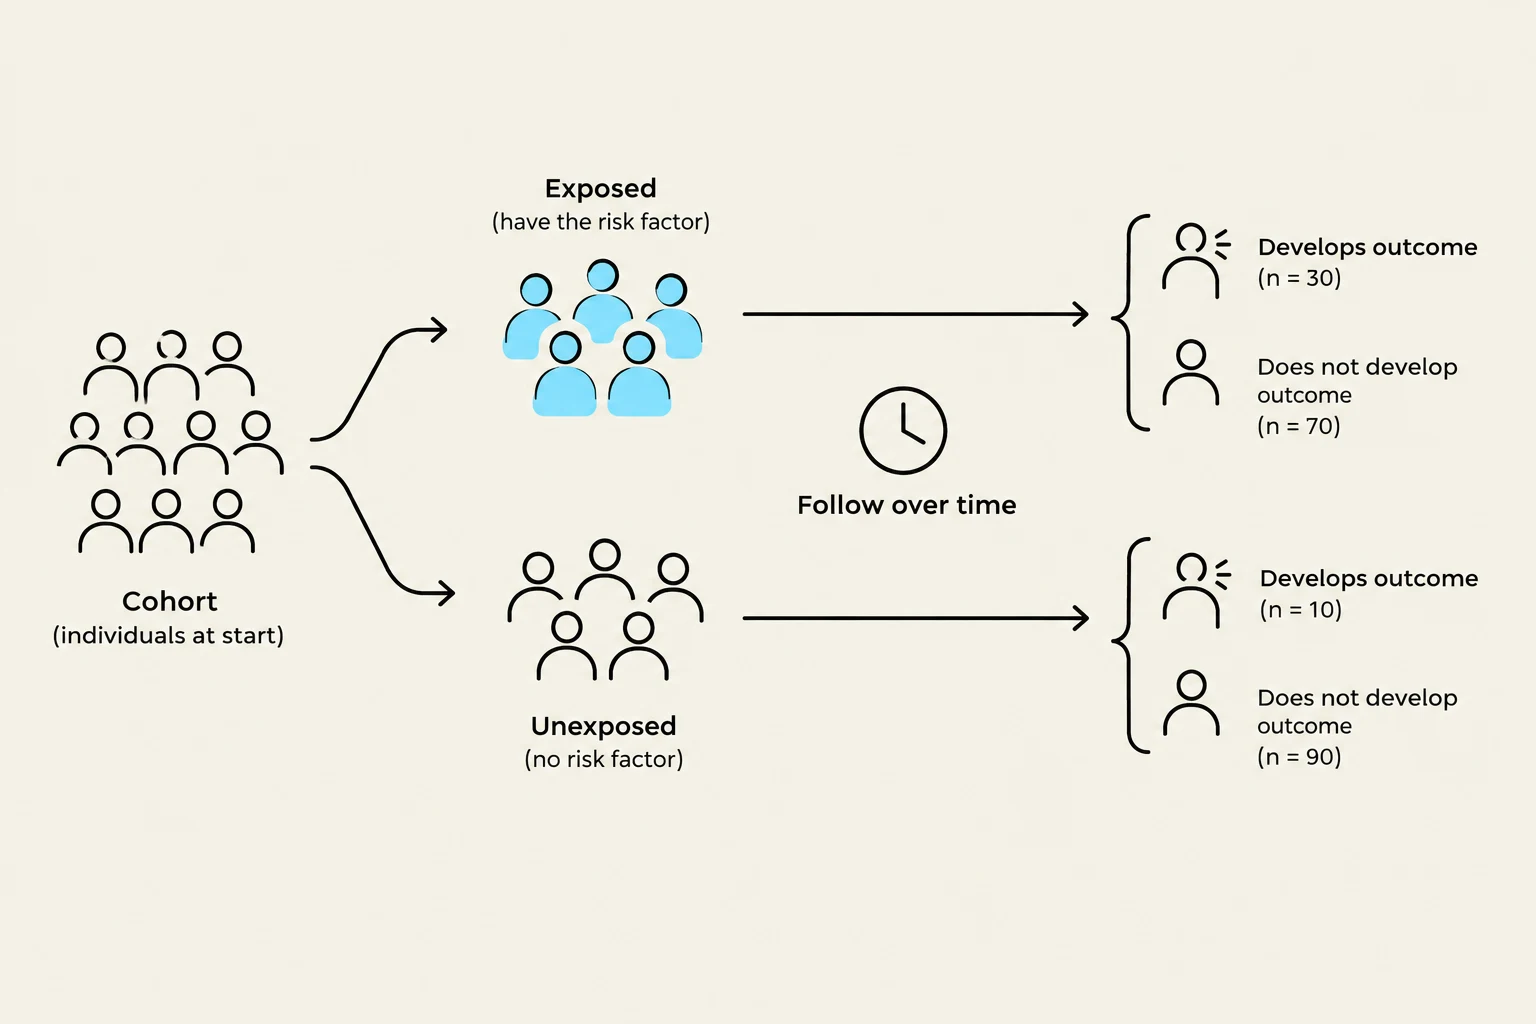
The primary measure of association in a cohort study is the relative risk (RR). It compares the incidence of disease in the exposed group to the incidence in the unexposed group:
RR=Incidence in unexposedIncidence in exposed
If $RR > 1$, the exposure is associated with an increased risk of the outcome.
This diagram illustrates a cohort study design. A group of individuals (cohort) is divided into exposed and unexposed groups based on the presence of a risk factor. Over time, the outcomes for both groups are observed to determine the association between the risk factor and the outcome.
Exam Tip: When evaluating a cohort study, always check for losses to follow-up. If a significant number of participants leave the study, and those who leave are systematically different from those who stay, the results may be biased. Such observations are referred to as censored observations.
Case-Control Studies
When a disease is rare, following a large cohort until enough people develop the disease becomes impractical or too expensive. In these instances, researchers use a case-control study.
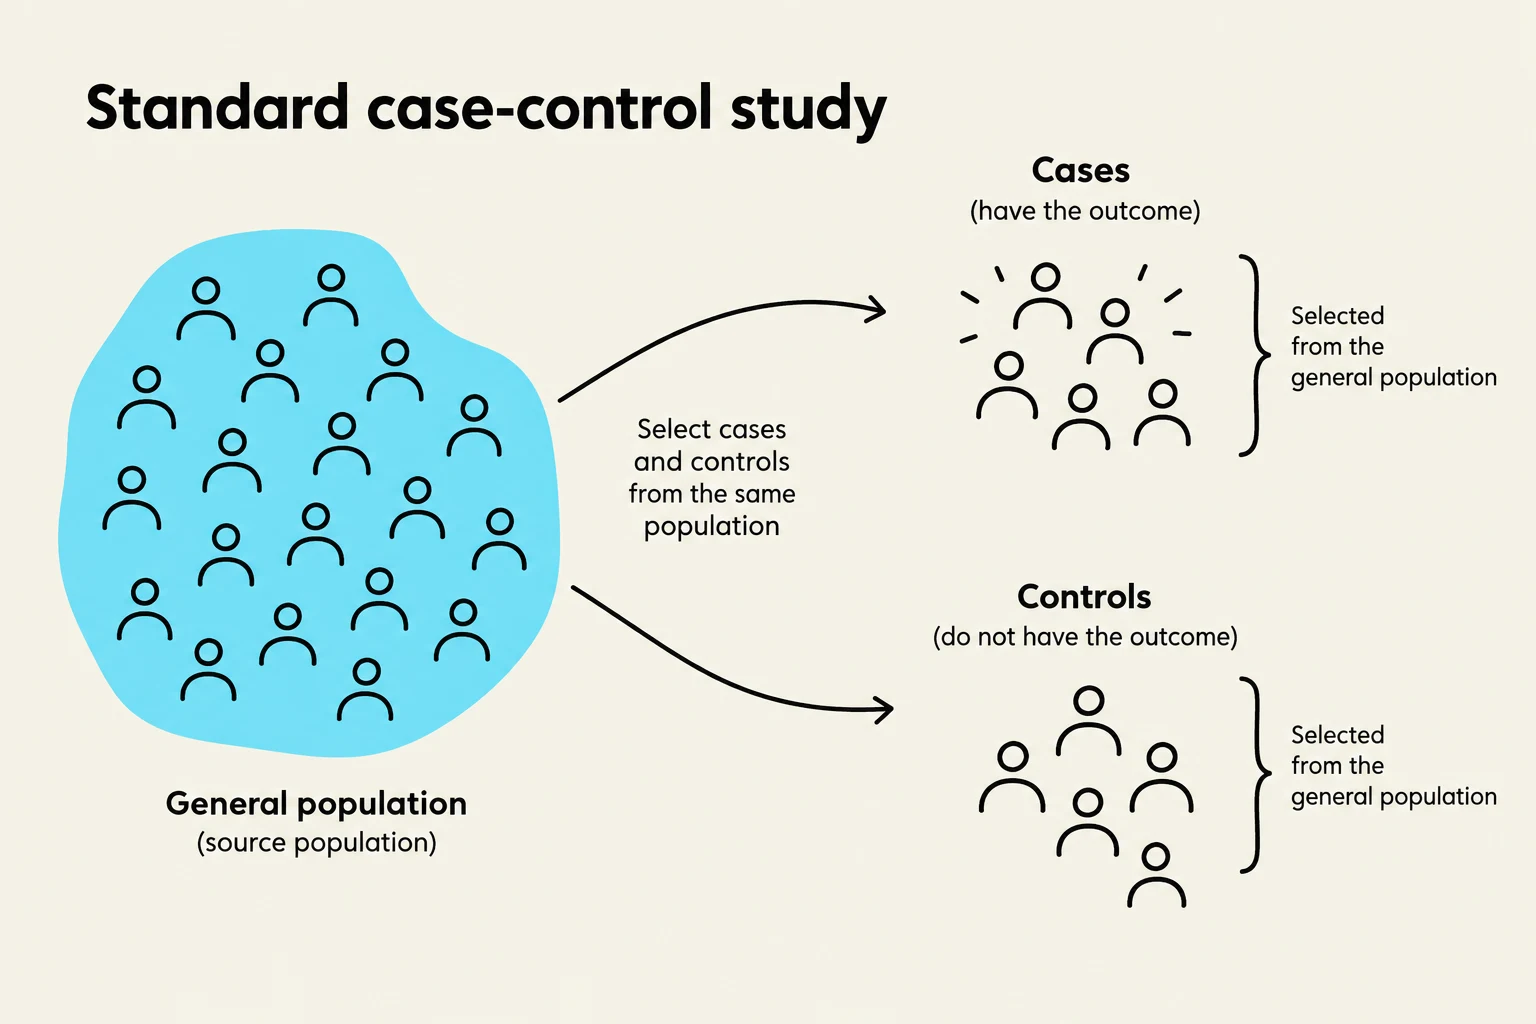
In this design, investigators identify individuals who already have the disease (cases) and a comparable group of individuals without the disease (controls). They then look backward in time to compare the frequency of exposure to a suspected risk factor in both groups.
The Exposure Odds Ratio
Because case-control studies do not measure incidence (since the number of cases is predetermined by the researcher), we cannot calculate relative risk. Instead, we use the exposure odds ratio (OR) to estimate the strength of the association:
OR=Odds of exposure in controlsOdds of exposure in cases
Advanced Case-Control Variations
To improve efficiency or handle large datasets, epidemiologists use specialized variations:
Case-based case-control study: A design where cases are identified over a period, and controls are selected from the same population.
Nested case-control study: A highly efficient design where cases and controls are both drawn from a pre-existing, well-defined cohort. This allows researchers to use expensive, high-quality data collected for the original cohort study.
Case-cohort study: A variation where a sample of the original cohort is selected to serve as the comparison group for all cases that occur within the entire cohort.
This diagram illustrates a standard case-control study design. It shows how individuals are selected from a general population to form two groups: cases (those with the outcome of interest) and controls (those without the outcome). Both groups are selected from the same source population to ensure comparability.
Cross-Sectional Studies
A cross-sectional study provides a "snapshot" of a population at a single point in time. It measures both exposure and disease status simultaneously. While useful for determining the prevalence of a disease, it is difficult to establish whether the exposure preceded the disease, making it less effective for determining causality.
The Complexity of Age, Cohort, and Period Effects
When analyzing cross-sectional data, researchers must be careful not to confuse different types of trends:
Age effect: Changes in the rate of a condition as people get older, regardless of when they were born.
Cohort effect: Changes in the rate of a condition based on the year of birth (e.g., a generation with different dietary habits).
Period effect: A global change that affects the entire population at a specific time, such as a new medical treatment or a war.
For example, a cross-sectional study might show that disease prevalence decreases with age. However, if recent birth cohorts have much higher rates of disease than older cohorts (a strong cohort effect), this can mask the true relationship between aging and the disease.
Potential Biases and Limitations
All observational studies are subject to errors that can distort the true relationship between exposure and outcome.
Selection and Information Bias
Selection bias: Occurs when the process of choosing participants for the study creates a sample that is not representative of the target population.
Recall bias: A type of information bias common in case-control studies, where cases (who are searching for a reason for their illness) may remember past exposures more vividly or differently than healthy controls.
Survival bias: Occurs when the study population is limited to those who have survived long enough to be included, potentially excluding those who died early due to the exposure being studied.
The Ecologic Fallacy
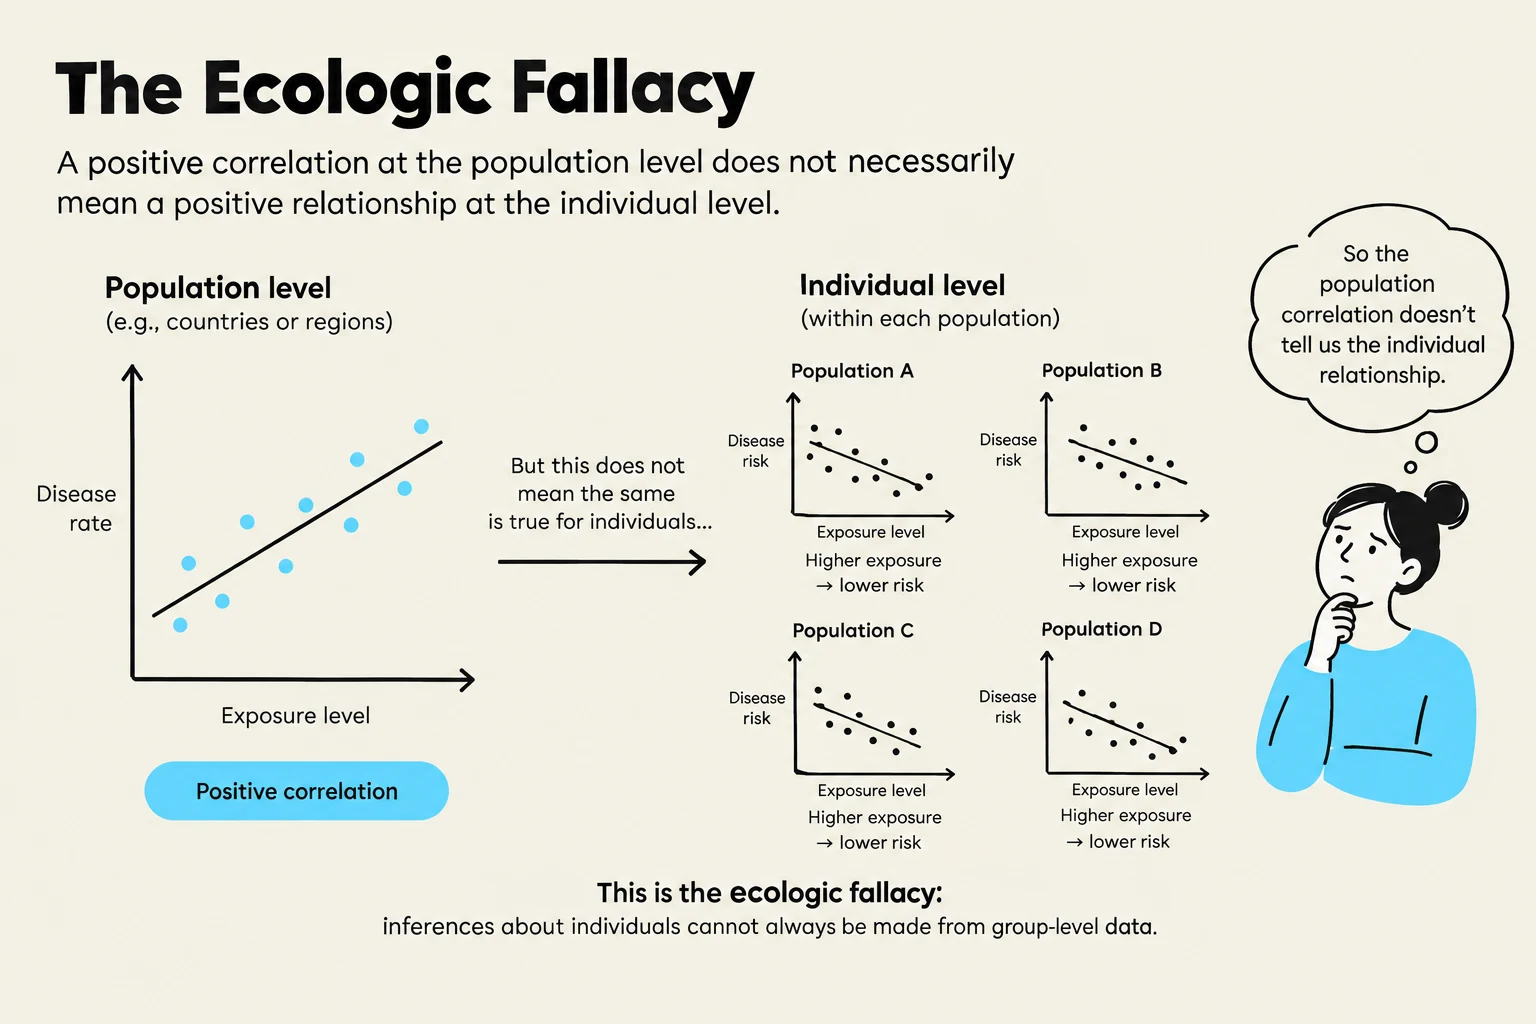
While not an individual-level design, it is vital to understand the ecologic fallacy. This occurs when an investigator makes an inference about an individual based on aggregate data from a group. For instance, if a study finds that countries with higher average income have higher rates of motor vehicle injuries, it would be a fallacy to assume that high-income individuals are at higher risk.
The ecologic fallacy illustrates that a correlation observed at a population level does not necessarily imply the same relationship at the individual level. The image shows a positive correlation between disease rate and exposure level at the population level, but individual-level data from different populations reveal negative correlations between disease risk and exposure level.
Keep reading for free.
Create an account to finish this reading and make it part of your study routine.