Introduction to Macroeconomics and Gross Domestic Product (GDP)
This content introduces macroeconomics and Gross Domestic Product (GDP) as a key metric for measuring an economy's size and performance. It details GDP components, its uses in measuring living standards, economic growth, and business cycles, and discusses the expenditure approach to calculation. Limitations of GDP are
How do we measure the size and performance of an economy? To answer this, we must first distinguish between the two primary lenses of economic study: microeconomics and macroeconomics. While microeconomics focuses on the decision-making processes of individual households, firms, and specific markets, macroeconomics examines economy-wide outcomes and aggregates. Instead of looking at why a single person buys a car, a macroeconomist looks at large-scale indicators such as unemployment, inflation, recessions, and economic growth.
Gross Domestic Product (GDP)
The primary metric used to measure the size and performance of an economy is Gross Domestic Product (GDP). GDP is defined as the market value of all final goods and services produced within a country during a specific period. Because it represents the sum of all output (or income) resulting from economic activity, it serves as a critical barometer for the health of an economy.
To understand what counts toward GDP, we must look at its specific components:
Market Value: Since we cannot add "apples to oranges," we use market prices to provide a common unit for aggregation.
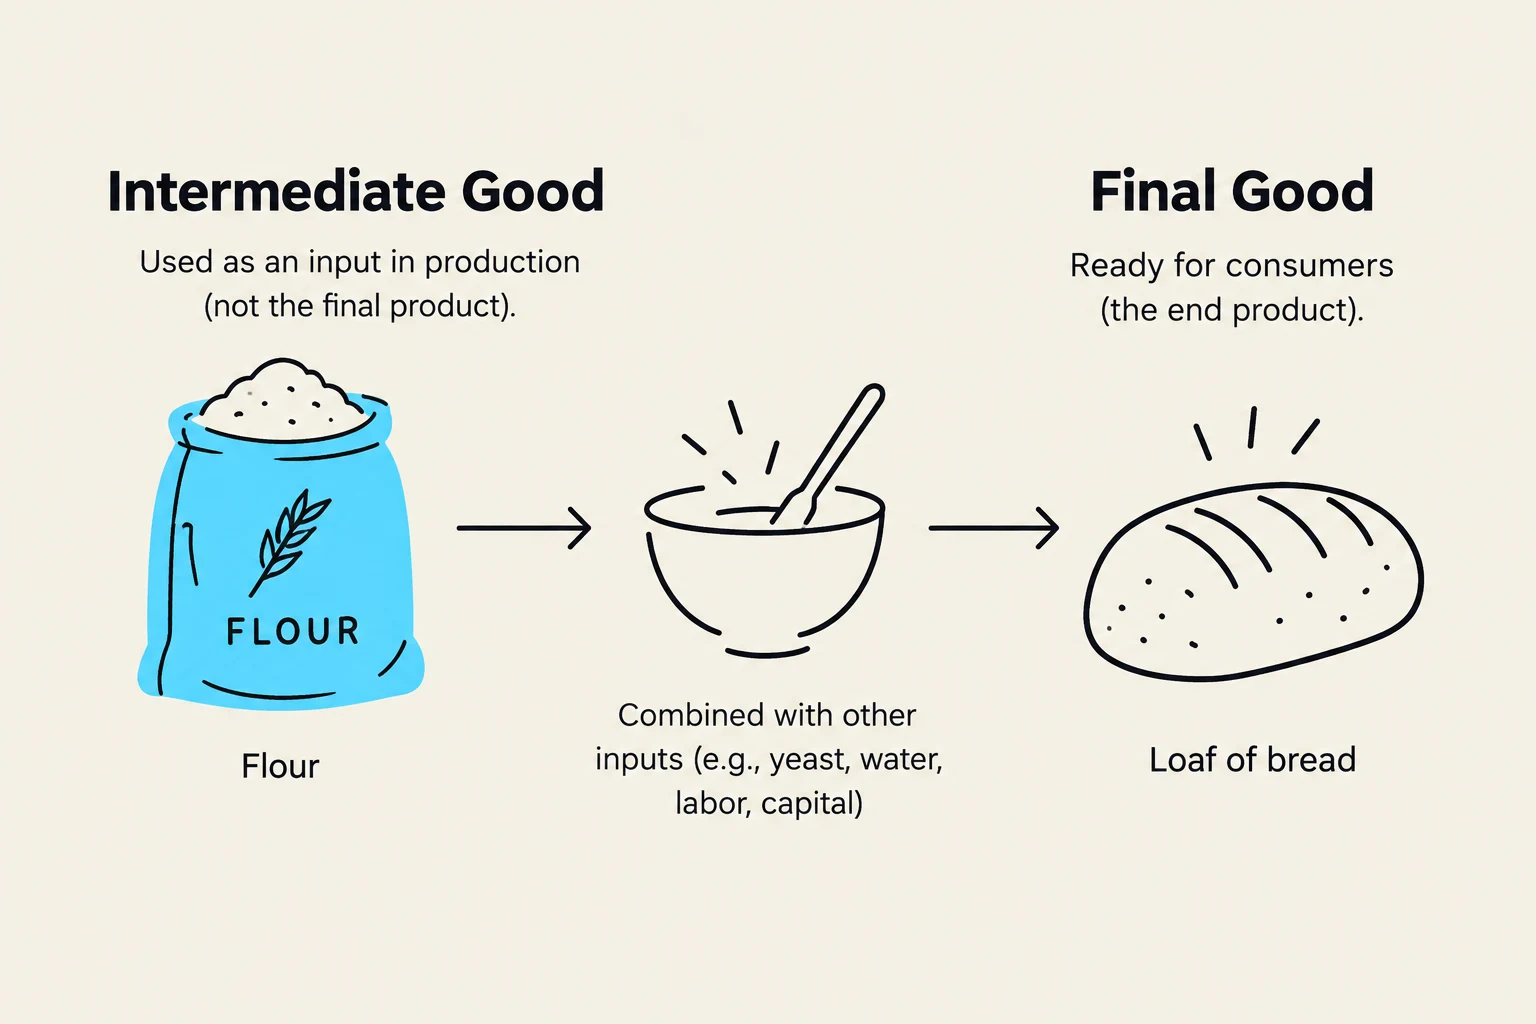
Final Goods: GDP only counts goods purchased by the final user. We exclude intermediate goods (like the tires sold to a car manufacturer) to avoid "double counting" the same value multiple times.
Within a Country: GDP measures production that occurs within a nation's borders, regardless of whether the company is foreign-owned.
Specific Period: It measures production within a set timeframe to ensure we are looking at current economic activity.
This diagram illustrates the difference between an intermediate good (flour) and a final good (loaf of bread), showing how raw materials are transformed through production processes into products ready for consumption.
The Three Major Uses of GDP
Economists utilize GDP for three fundamental purposes: measuring living standards, tracking economic growth, and identifying business cycles.
1. Measuring Living Standards
While total GDP tells us the size of an economy, it does not tell us how well the average person is doing. To compare the well-being of different populations, we use GDP per capita. This is calculated by dividing the total GDP by the population:
GDP per capita=PopulationGDP
Exam Tip: A country can have a massive total GDP (like China) but a much lower GDP per capita than a smaller, wealthier nation (like Australia). Always use per capita figures when comparing the material standard of living between nations.
2. Measuring Economic Growth
Economic growth is defined as an increase in real GDP over time. It is vital to distinguish between Nominal GDP (measured in current prices) and Real GDP (adjusted for inflation). If prices rise but production stays the same, Nominal GDP will increase, but Real GDP will not. To see if an economy is actually producing more goods and services, we must look at Real GDP.
This graph illustrates the difference between nominal GDP and real GDP, showing how real GDP adjusts for inflation to provide a more stable measure of economic growth.
3. Measuring Business Cycles
Economies do not grow in a straight line; they experience short-run fluctuations known as business cycles. These cycles consist of:
Expansion: The movement from a trough toward a peak, where economic activity increases.
Contraction: The movement from a peak toward a trough, where economic activity decreases.
Recession: A short-term economic downturn.
Peak and Trough: The highest and lowest points of the cycle, respectively.
Calculating GDP: The Expenditure Approach
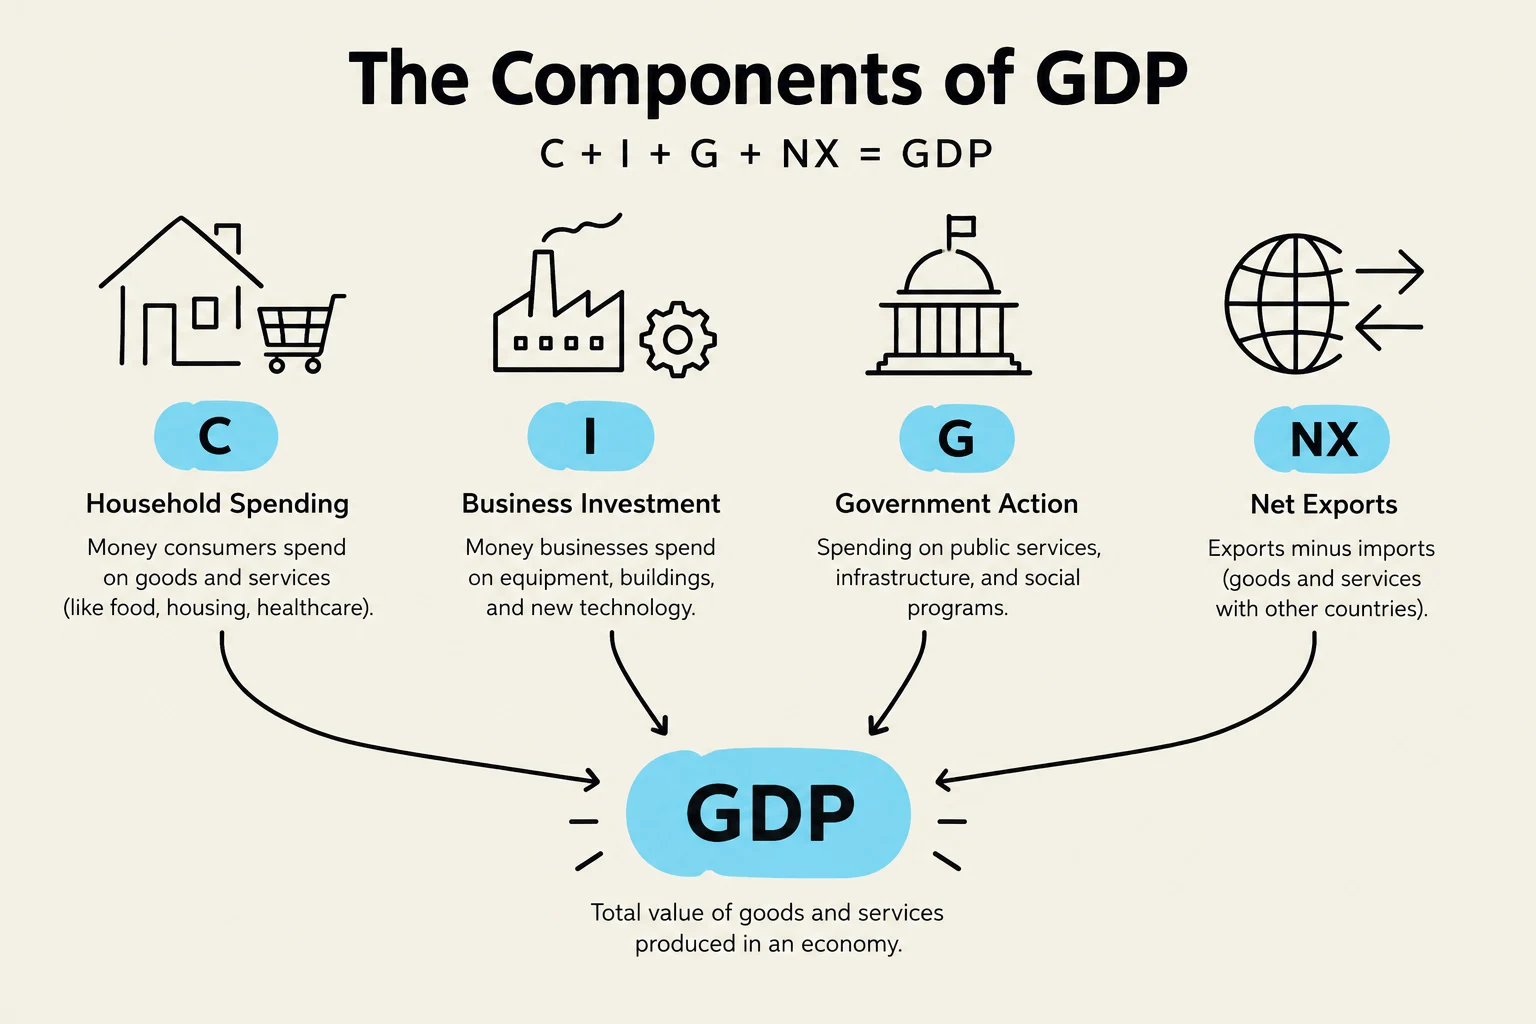
In the United States, the Bureau of Economic Analysis (BEA) uses "national income accounting" to tally these figures. One of the most common methods is the Expenditure Approach, which sums the spending of four different groups:
$Y = C + I + G + NX$
Where:
C (Consumption): Purchases of final goods and services by households. This includes durable goods (like cars) and nondurable goods (like food).
I (Investment): Private spending on new capital goods, residential construction, and changes in business inventories. Note that buying stocks or bonds is not considered investment in GDP because it does not represent new production.
G (Government Purchases): Spending by federal, state, and local governments on goods and services, such as public works or salaries. This excludes "transfer payments" like Social Security, as they are not payments for current production.
NX (Net Exports): The value of exports minus imports.
This diagram illustrates the four main components of Gross Domestic Product (GDP): Consumption (C), Investment (I), Government Spending (G), and Net Exports (NX). GDP represents the total value of goods and services produced in an economy.
Limitations of GDP
While GDP is a powerful tool, it is not a perfect measure of human prosperity. It has several significant shortcomings:
Nonmarket Goods: It misses household production, such as cleaning your own home or mowing your own lawn.
Underground Economy: It does not account for unreported cash income or illegal market transactions.
Environmental Quality: GDP does not factor in the health costs of pollution or the depletion of natural resources.
Leisure: GDP measures production but does not value the time people spend relaxing or enjoying life.
Because of these gaps, economists often look to alternative measures like the Human Development Index (HDI), which combines income with education and life expectancy to provide a more holistic view of well-being.
Keep reading for free.
Create an account to finish this reading and make it part of your study routine.