


When studying fire alarm systems under the 2023 National Electrical Code (NEC), it is easy to become lost in the technicalities of wiring, voltage drops, and circuit classifications. However, the fundamental "why" behind these strict regulations lies in the staggering reality of fire frequency and its impact on society. Understanding the statistical landscape of fire incidents provides the necessary context for why early detection and reliable notification systems are not just electrical installations, but life-saving necessities.

The Scale of Structure Fires
To understand the demand for fire protection, we must first look at the sheer volume of incidents occurring across the United States. According to reports from the National Fire Protection Association (NFPA), the frequency of fire incidents is constant and high.
During a single one-year reporting period, there were approximately 490,500 structure fires recorded. To put this into perspective, consider the response frequency of emergency services: on average, fire departments in the U.S. respond to a fire incident every 23 seconds.
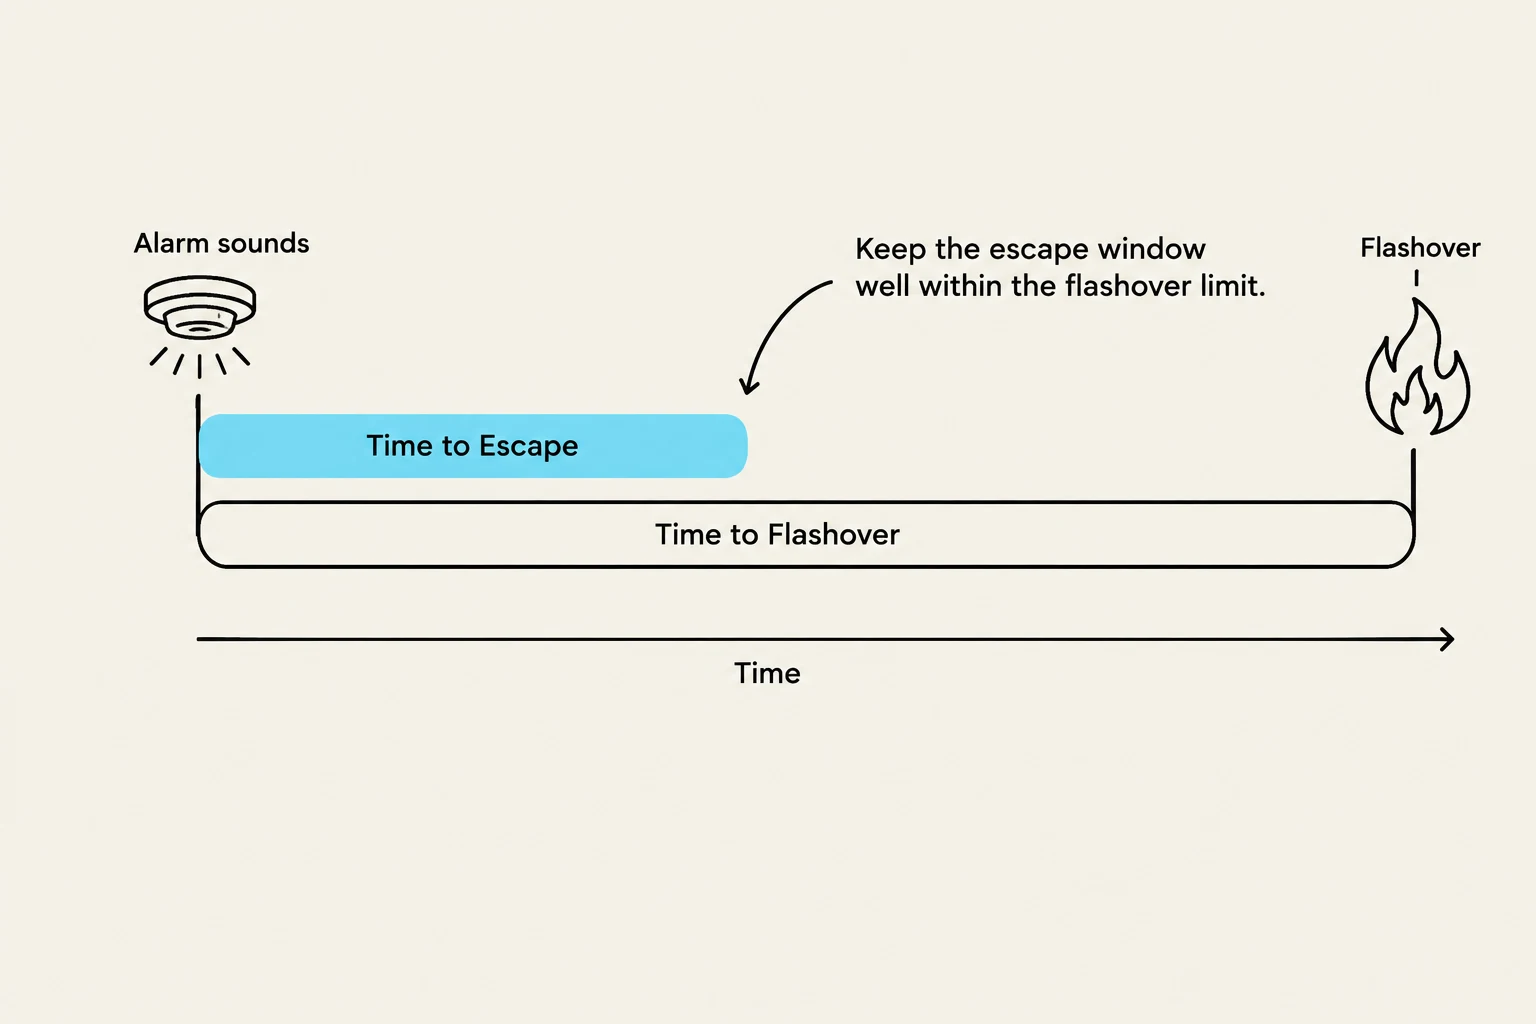
This constant cycle of emergencies places an immense strain on municipal resources and highlights the importance of automated systems that can detect a fire and alert occupants before the fire department even arrives on the scene.
Fire Statistics
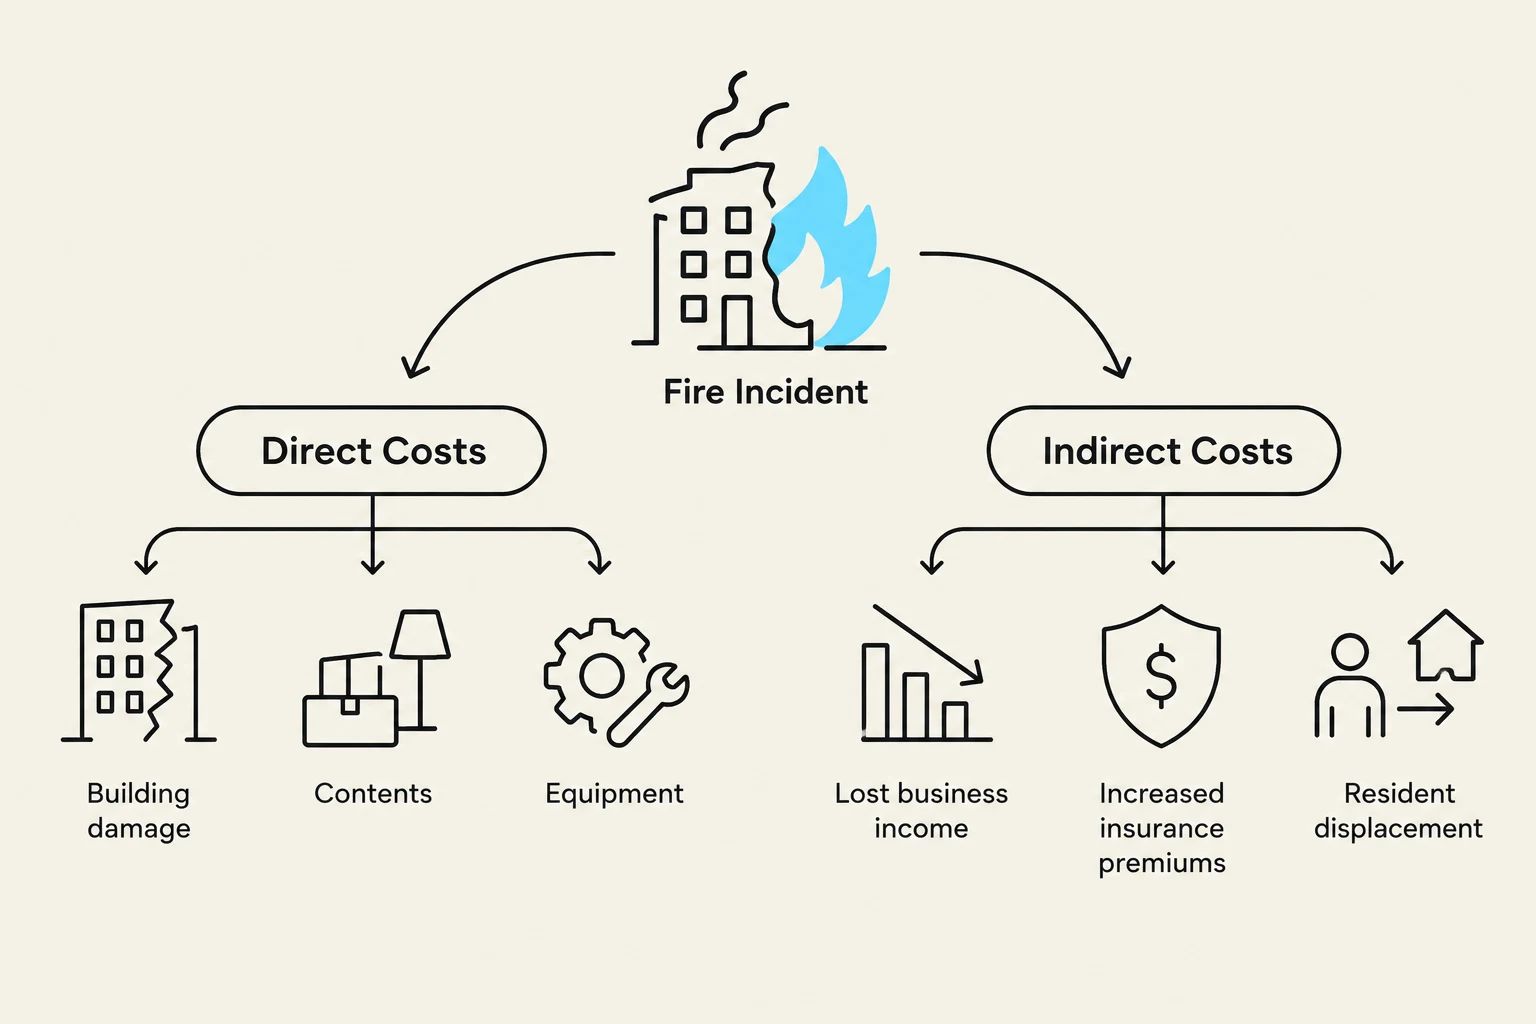
Economic Impact and Property Loss
Keep reading for free.
Create an account to finish this reading and make it part of your study routine.
Continue reading freeAlready have an account? Log in
Updated