Introduction to Fire Alarm Systems Statistics and Reliability
An overview of fire alarm systems, including statistics on fire incidents from the NFPA, human impact, and the importance of reliable design and installation according to the 2023 NEC.
Understanding the scale of fire-related incidents is the first step in appreciating the critical role played by fire alarm systems. By examining data provided by major safety organizations, we can grasp the frequency of fire emergencies and the profound impact they have on public safety.
The Scale of Fire Incidents
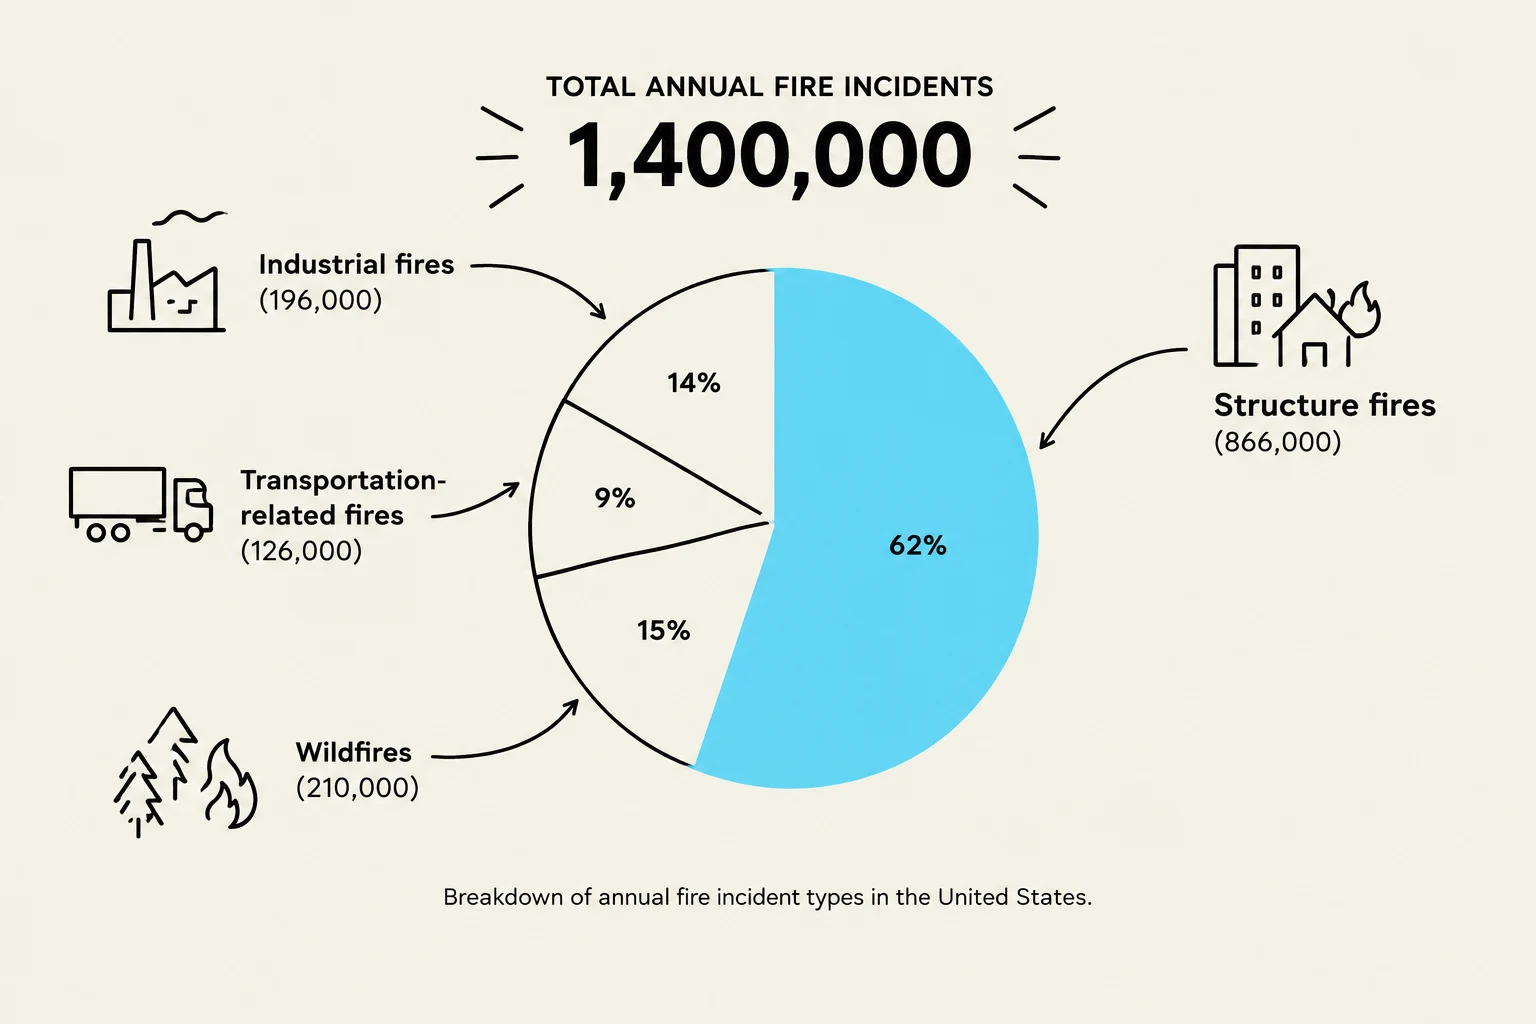
This pie chart illustrates the breakdown of annual fire incidents in the United States, totaling 1,400,000. Structure fires account for the largest portion at 62%, followed by industrial fires at 14%, wildfires at 15%, and transportation-related fires at 9%.
According to recent reports from the National Fire Protection Association (NFPA), the United States experiences a staggering number of fire incidents annually. In a single year, approximately 1,400,000 fires were reported across the country.
To put this frequency into perspective, a fire occurs in the United States approximately every 24 seconds. These incidents are not limited to a single environment; the reported figures encompass a wide variety of fire types, including:
Structure fires
Industrial fires
Transportation-related fires
Wildfires
Human Impact and Consequences
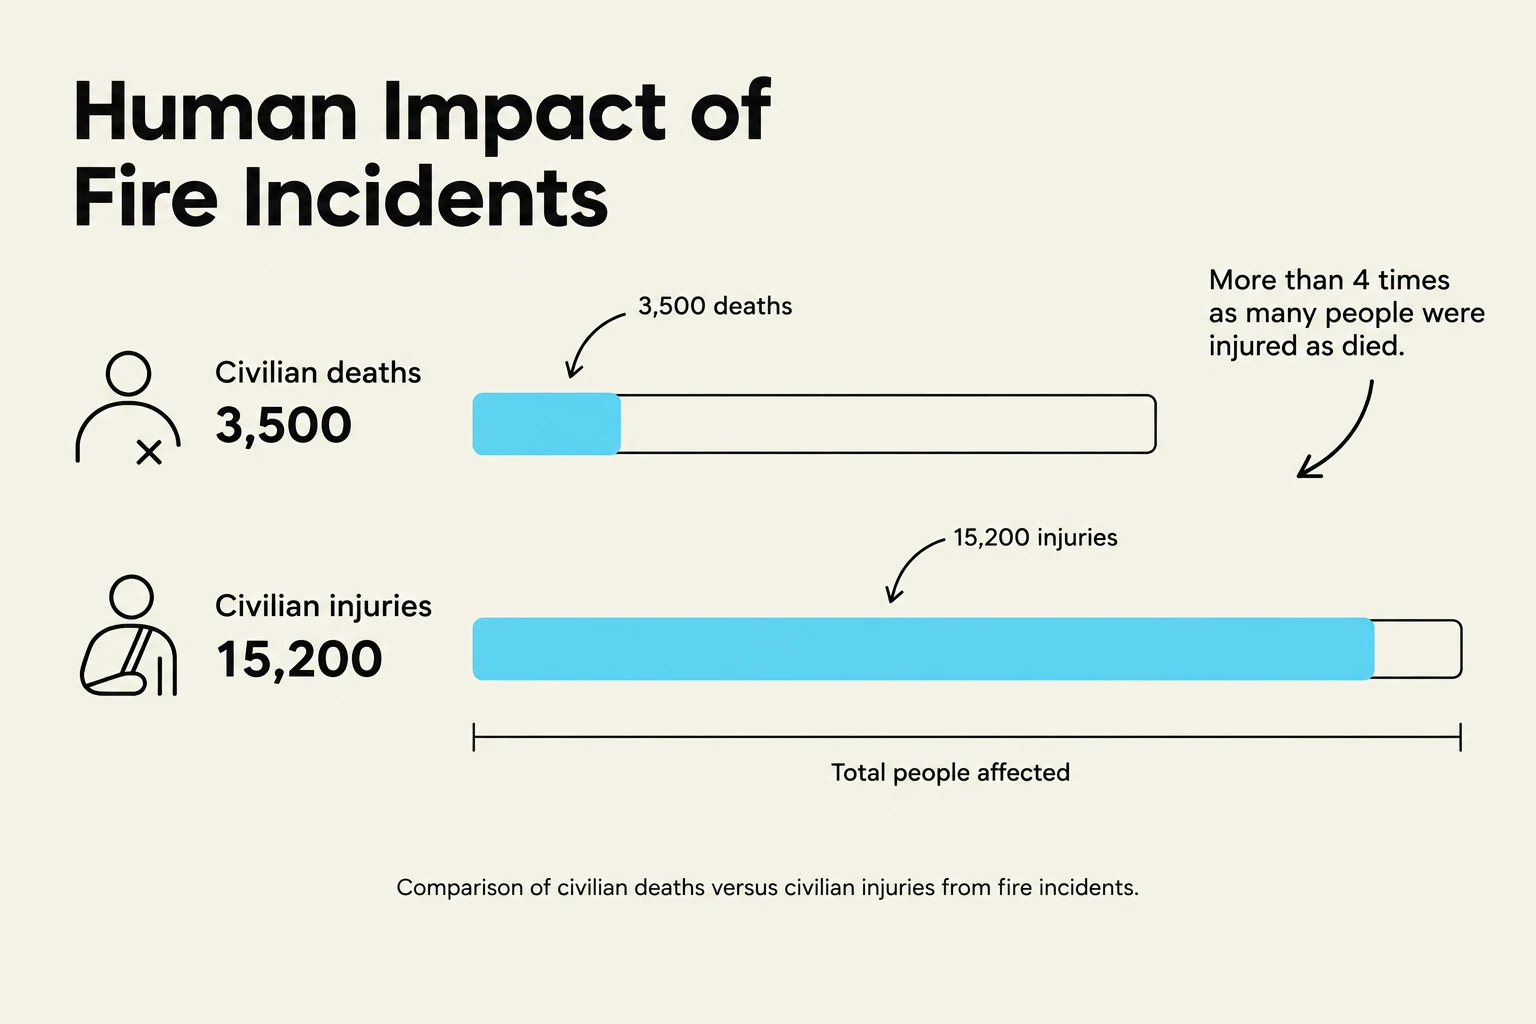
Comparison of civilian deaths versus civilian injuries from fire incidents.
Beyond the physical damage to property, the human cost of these fires is significant. The statistical data highlights a heavy toll on civilian populations, with reported cases including:
3,500 civilian deaths
15,200 civilian injuries
These figures underscore the urgent necessity for effective life-safety systems to mitigate the risks associated with fire.
The Importance of Reliable Design and Installation
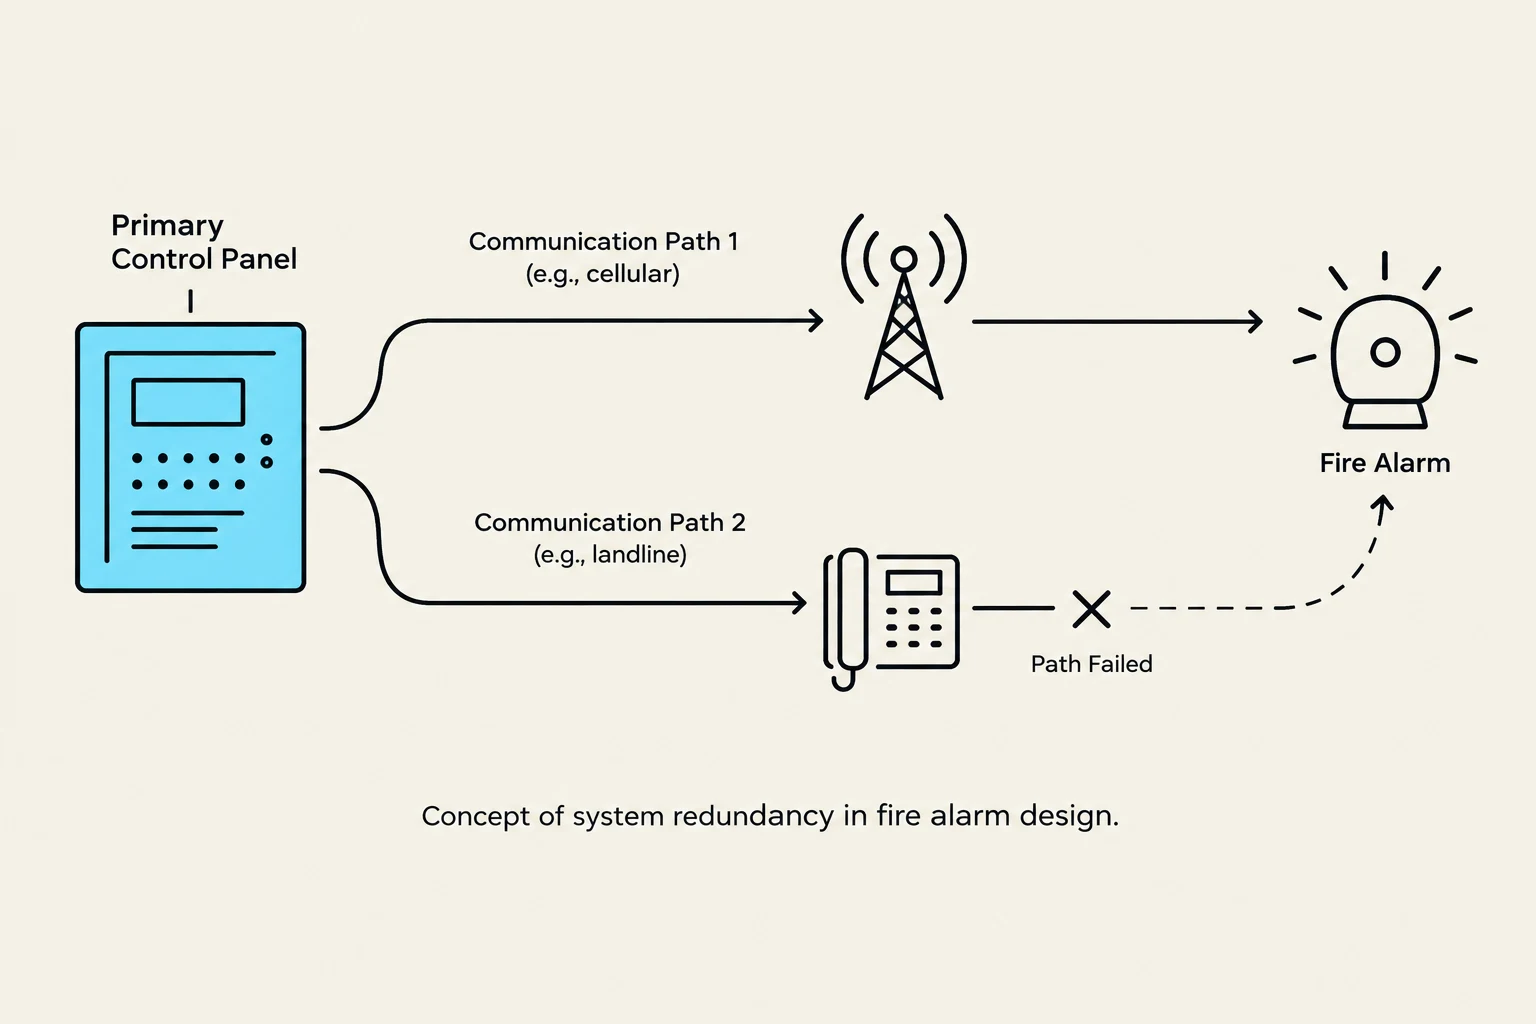
Diagram illustrating system redundancy in fire alarm design, showing two communication paths from a primary control panel to a fire alarm, with one path potentially failing.
Because fire alarm and signaling systems are specifically designed to protect people, property, and buildings (including their contents), they must be engineered and installed with extreme care to ensure maximum reliability.
Modern fire alarm designs often incorporate redundancy—the inclusion of extra components to prevent a single point of failure—to enhance safety. However, even the most sophisticated design cannot compensate for poor execution in the field.
Critical Note: Improper field installations can render even the most advanced fire alarm designs useless.
Historically, failures in fire alarm systems have led to tragic losses of life and property. Therefore, strict adherence to design protocols and the standards outlined in the 2023 National Electrical Code (NEC) is essential for ensuring that these systems perform when they are needed most.
Keep reading for free.
Create an account to finish this reading and make it part of your study routine.