This reading introduces the fundamental concepts of business statistics, including data types, sources, study methods, data management, sampling techniques, and the distinction between descriptive and inferential statistics. It aims to equip readers with the foundational knowledge for data-driven decision-making.
In the modern business landscape, data is often described as the "crown jewels" of an organization. Companies like Amazon use clickstream and purchase data to personalize user experiences, turning raw information into actionable intelligence. But what exactly is statistics? In its singular form, statistics is a way of reasoning—a collection of tools and methods designed to help us understand the world. In its plural form, statistics refers to the actual quantities calculated from data.
To study business statistics, we must first understand the building blocks: data and variables. A datum is a single value, while data is the plural form. Data are facts, numbers, and other information—such as price, time, or location—that provide context to the elements being studied. A collection of this data is known as a data set.
Understanding Variables and Data Types
Every element within a data set possesses certain characteristics known as variables. To analyze data effectively, we must first categorize these variables into two primary types:
Qualitative (Categorical) Variables: These deal with descriptions and observations that cannot be measured numerically. Examples include marital status, socio-economic status, or the type of advertising medium used (radio, TV, or print).
Quantitative (Numerical) Variables: These represent numerical values that can be measured in specific units. Examples include salary, age, temperature, or the net profit of a company branch.
Beyond the nature of the variable, we also categorize data based on how it is collected over time:
Cross-sectional Data: This refers to data collected by observing many subjects (individuals, firms, or regions) at a single point in time, or without regard to differences in time. For example, a snapshot of the gross annual income of 1,000 households in Edmonton in the year 2016 is cross-sectional data.
Time Series Data: These are data points collected over successive time intervals, typically spaced at uniform intervals. A classic example is the daily closing value of the Dow Jones index.
This illustration contrasts cross-sectional data, which captures multiple subjects at a single point in time, with time series data, which tracks a single subject over multiple time points. It includes example tables and graphs for each data type.
Data Sources and Study Methods
Where data comes from is just as important as what the data says. We generally categorize data into two sources:
Secondary Data: This is data that has already been gathered by public or private sources, such as information found on government websites like Statistics Canada.
Primary Data: This is data collected firsthand for a specific purpose through new studies.
When conducting primary research, analysts typically focus on a response variable (the main variable of interest) and independent variables (other variables that may influence the response). Depending on how these variables are handled, the study will fall into one of two categories:
Experimental vs. Observational Studies
In an experimental study, the researcher actively manipulates the independent variables to see if they cause a change in the response variable. For instance, a company might change its advertising strategy (independent variable) to see if it affects sales (response variable).
In contrast, an observational study involves observing and measuring variables without any manipulation or control over the factors of interest. If an analyst cannot control the independent variables, the study is strictly observational.
Exam Tip: To distinguish between these two, ask yourself: "Is the researcher changing something on purpose to see what happens?" If yes, it is an experiment. If they are just watching what happens naturally, it is an observational study.
Data Management: Warehousing and Big Data
As organizations grow, the volume of data becomes overwhelming. To manage this, companies use data warehousing, which is a process of centralized data management and retrieval designed to create a central repository for all organizational data.
In the modern era, we also deal with big data. This refers to massive amounts of data, often collected in real time and in various forms, which requires rapid analysis to facilitate effective business decision-making.
Populations, Samples, and Sampling Techniques
In statistics, we rarely study every single person or object in existence. Instead, we focus on groups:
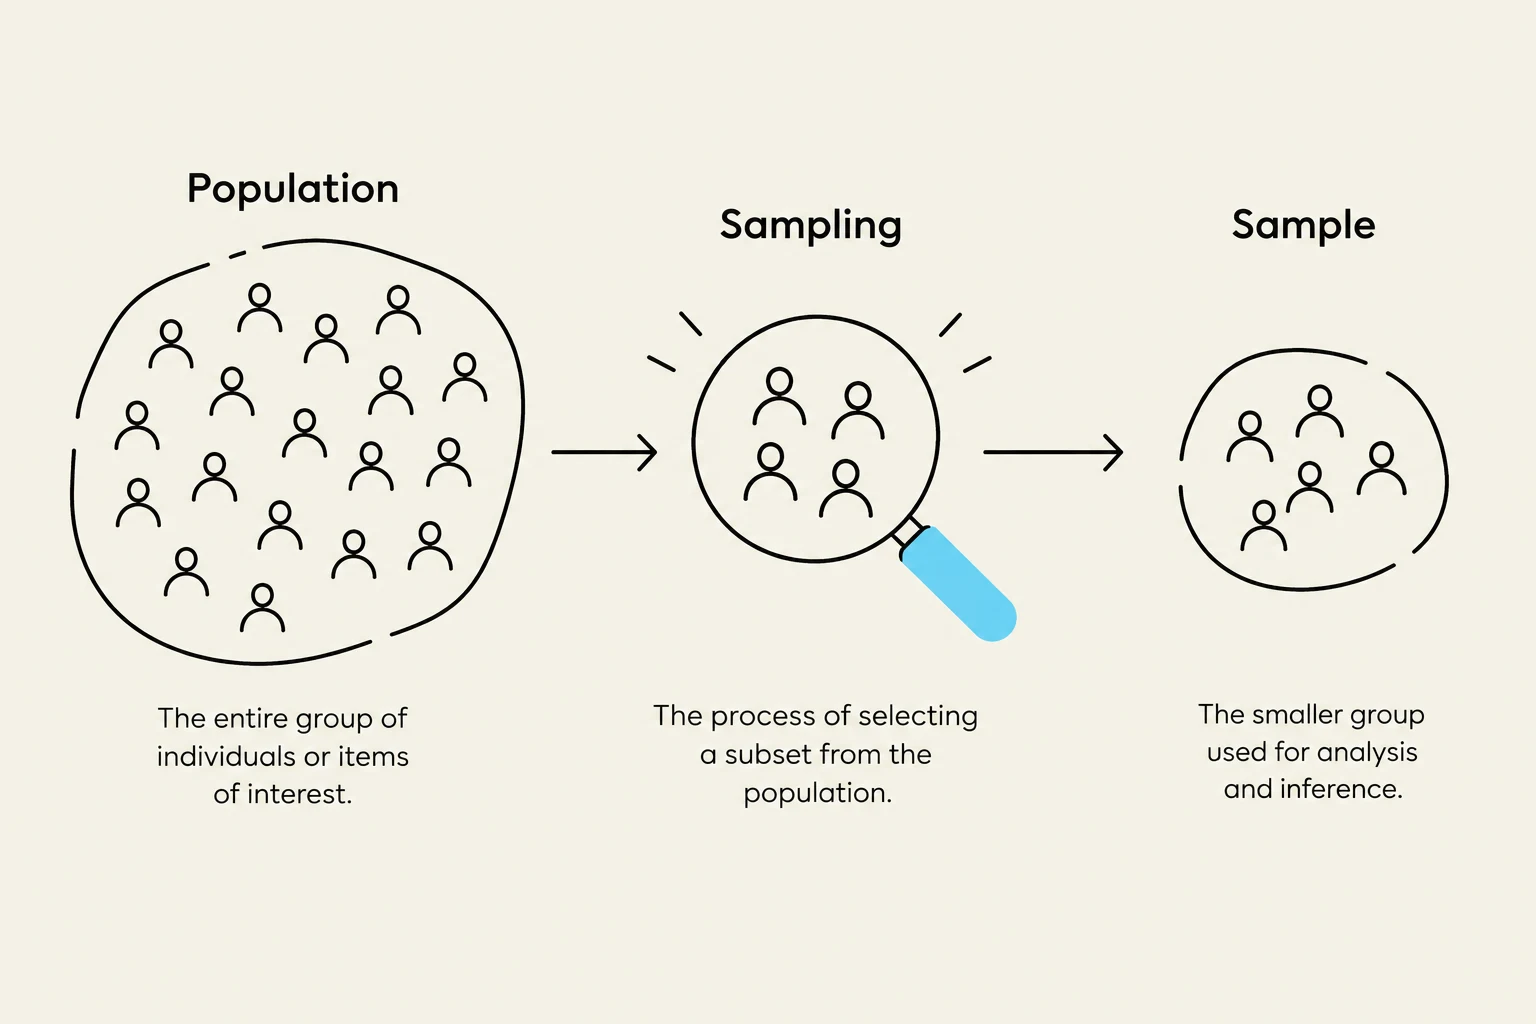
Population: The complete set of all elements about which we wish to draw conclusions.
Census: A study that examines every single member of a population.
Sample: A subset of elements selected from the population.
To ensure our sample accurately represents the population, we use probability sampling, where every element in the population has a known chance of being included. A key component of this is random sampling, where every possible set of n elements has the same chance of being selected.
When selecting these elements, researchers must decide between two methods:
Sampling with replacement: After an element is chosen, it is placed back into the population and can be chosen again.
Sampling without replacement: Once an element is chosen, it is not returned to the population. In many business cases, sampling without replacement is preferred.
This diagram illustrates the concepts of population, sampling, and sample in statistics. A population represents the entire group of interest, from which a sample is drawn through a process called sampling. The sample is a smaller subset used for analysis and inference.
Warning on Ethics: Be wary of "improper sampling." This occurs when a researcher purposely selects a biased, non-random sample to overrepresent certain views to support a desired conclusion.
Descriptive vs. Inferential Statistics
The ultimate goal of business statistics is to turn data into knowledge. This is achieved through two distinct approaches:
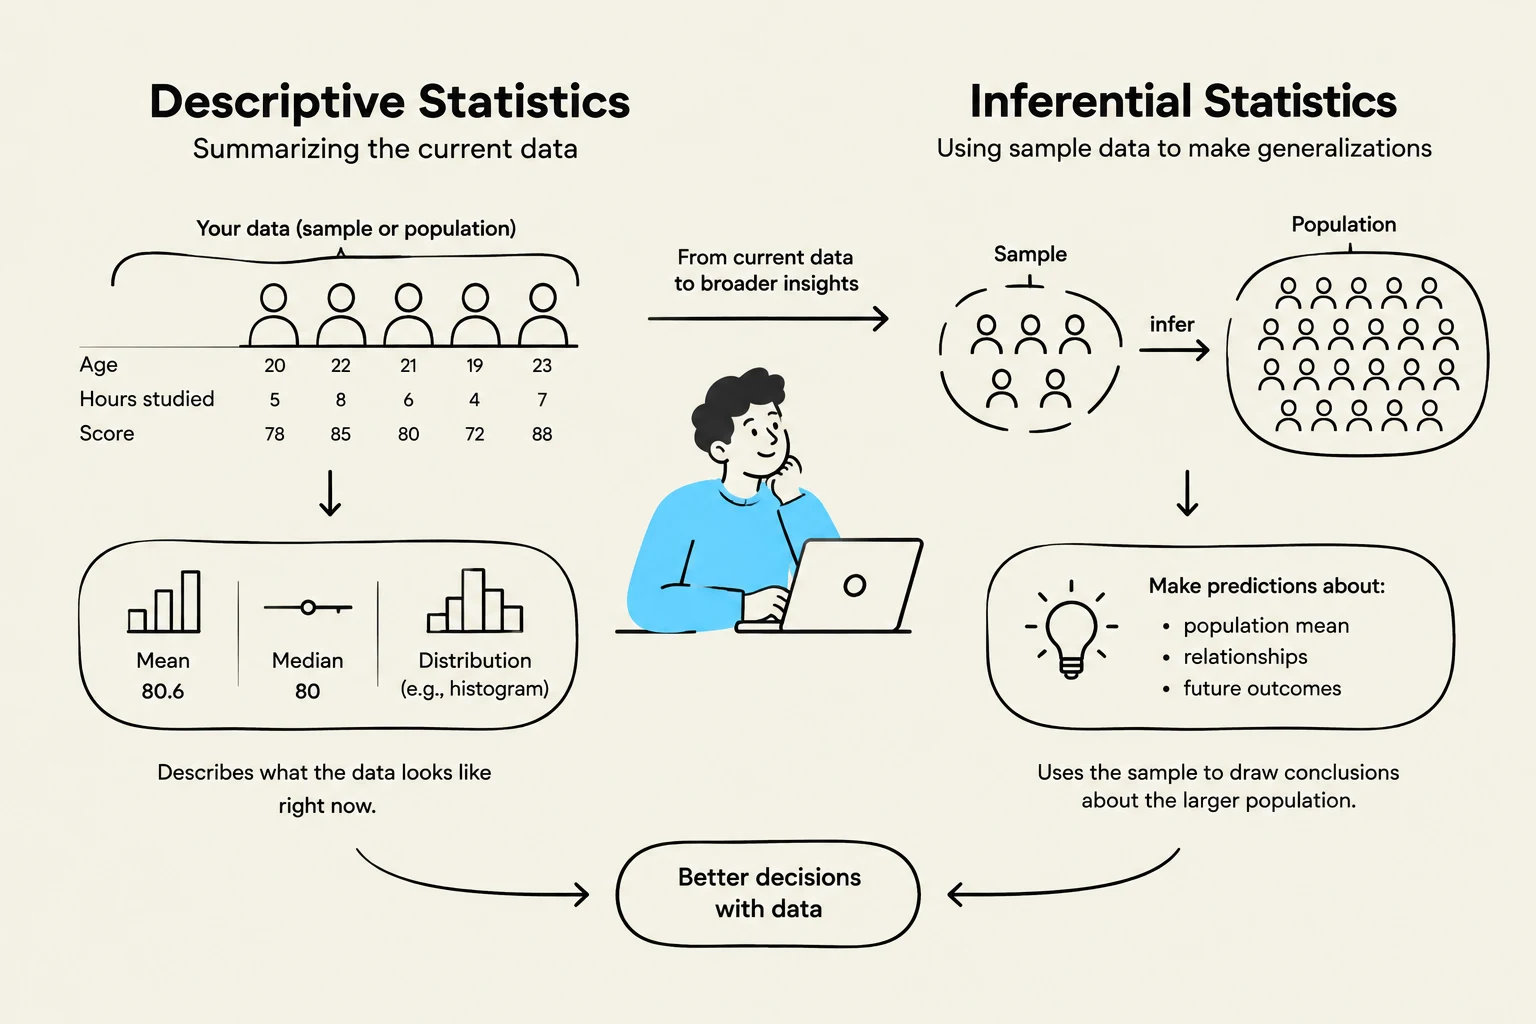
Descriptive Statistics: This involves simply describing what the data shows. It summarizes the characteristics of the data set at hand without looking further.
Inferential Statistics: This goes a step further. It uses sample data to reach conclusions that extend beyond the immediate data to make inferences about the larger population.
This illustration explains the difference between descriptive statistics, which summarizes current data, and inferential statistics, which uses sample data to make generalizations about a larger population. It shows how descriptive statistics can be used to understand the characteristics of a dataset, while inferential statistics allows for predictions and conclusions about a population based on a sample.
By mastering these fundamentals—from identifying variable types to understanding the leap from a sample to a population—businesses can move from mere guesswork to data-driven decision-making.
Keep reading for free.
Create an account to finish this reading and make it part of your study routine.