This content introduces fundamental business economics concepts including demand, supply, market equilibrium, and various measures of elasticity (price, income, and cross-price). It explains how these concepts influence business decisions, pricing strategies, and market growth.
Business economics provides the toolkit necessary for firms to navigate the complexities of the marketplace. At its core, the discipline seeks to understand how buyers and sellers interact to determine prices and quantities. By mastering the concepts of demand, supply, and equilibrium, managers can move beyond simple intuition to make data-driven decisions regarding pricing, capacity planning, and market expansion.
The Fundamentals: Demand, Supply, and Equilibrium
To understand a market, one must first look at the two opposing forces: demand and supply. Demand represents what buyers want, while supply represents what sellers are willing and able to offer for sale at various prices.
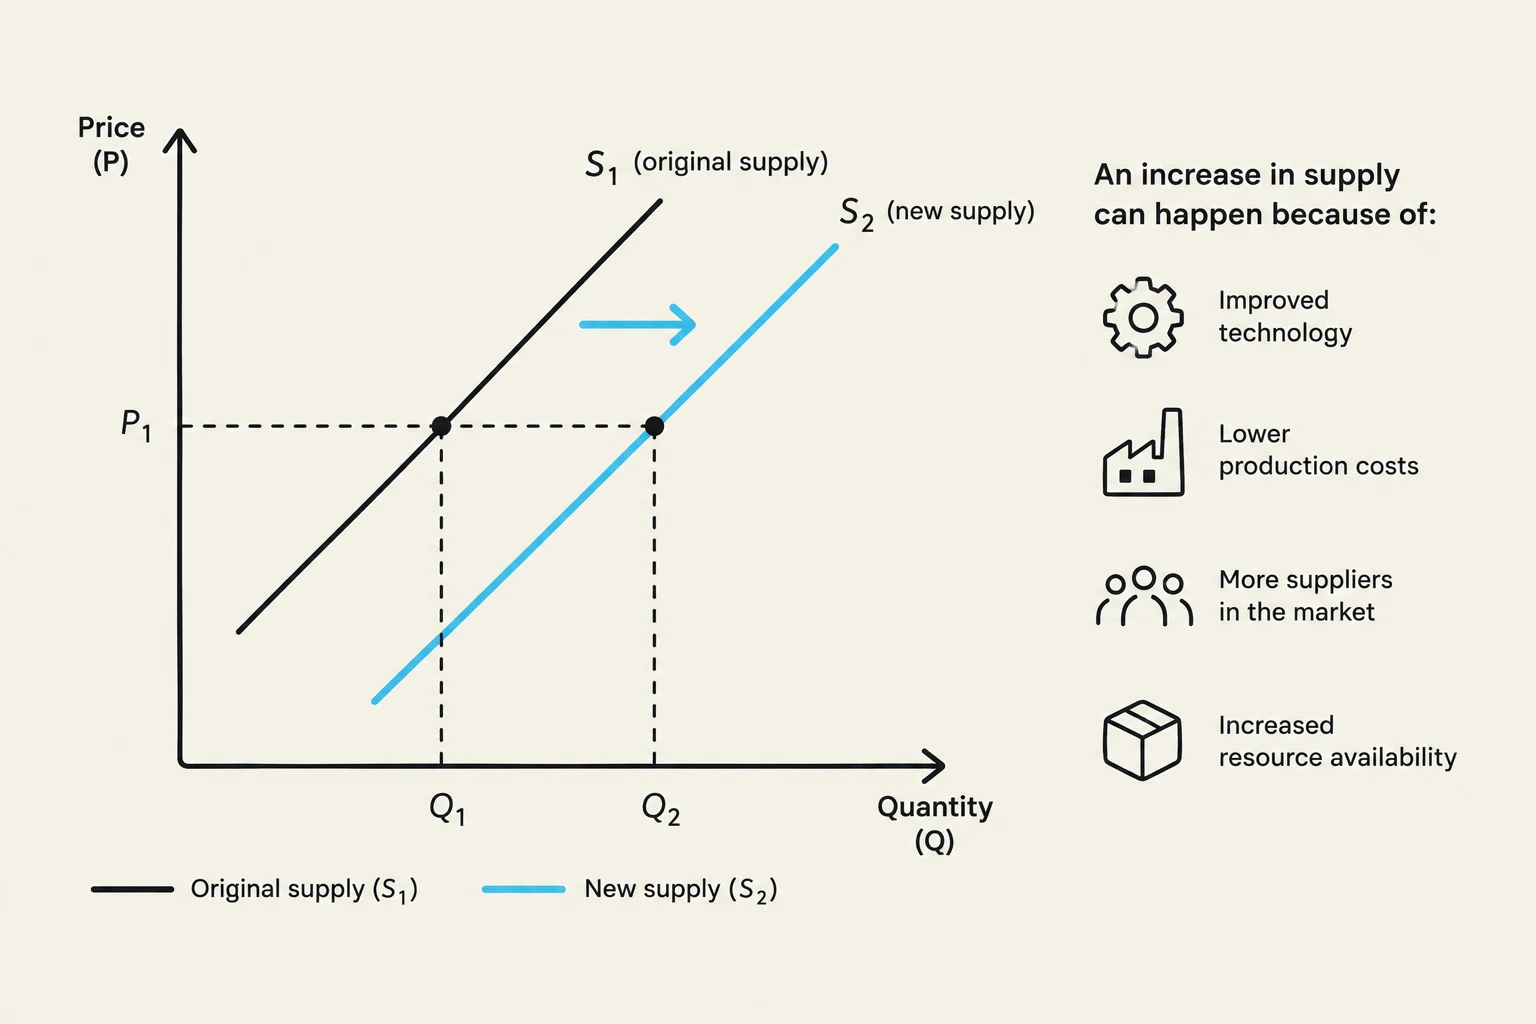
The Law of Supply states that, all other things being equal, as the price of a good rises, the quantity supplied tends to rise as well. This is because higher prices can make production more profitable, justifying extra shifts or higher-cost capacity. It is important to distinguish between a movement along the supply curve (caused by a change in the product's own price) and a shift of the supply curve (caused by non-price determinants like technology, input costs, or taxes).
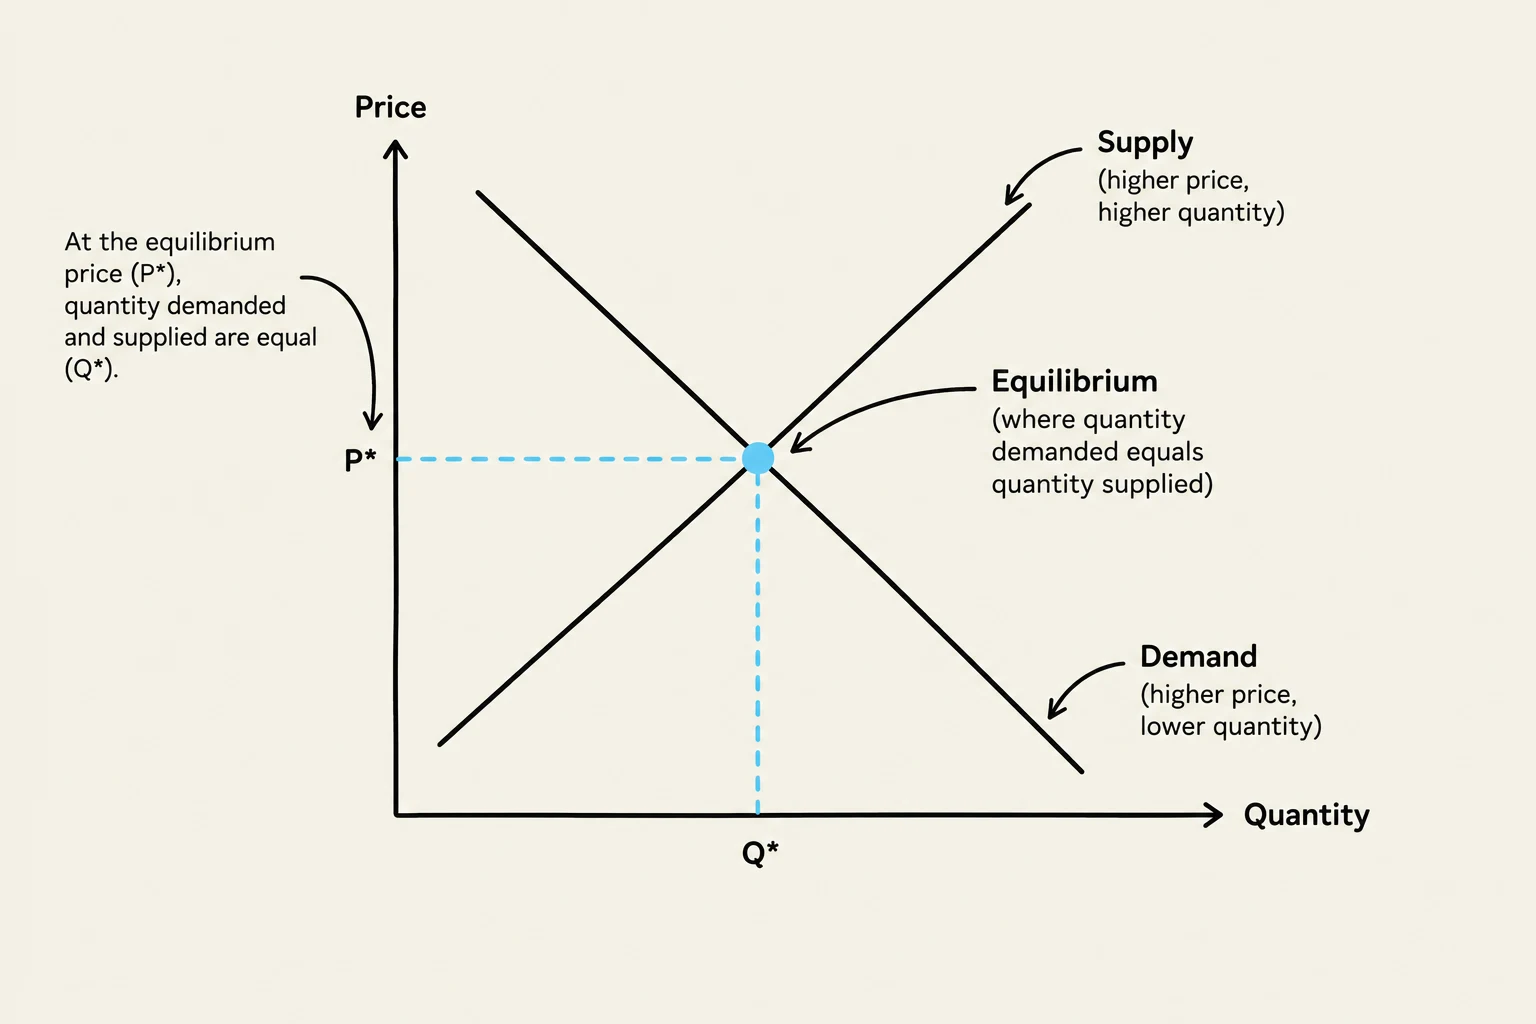
Market Equilibrium occurs at the intersection of the demand and supply curves. At this point, the quantity demanded by consumers exactly equals the quantity supplied by producers.
This graph illustrates the economic concept of market equilibrium, showing the intersection of supply and demand curves at a specific price (P*) and quantity (Q*).
If the market price is set below the equilibrium, a shortage occurs because consumers want to buy more than firms are willing to sell. Conversely, if the price is above equilibrium, a surplus is created, leading to unsold stock and downward pressure on prices.
While demand and supply tell us the direction of change, elasticity tells us the magnitude of that change. Elasticity measures how much one economic variable changes in response to a change in another variable.
Price Elasticity of Demand (PED)
PED measures how sensitive the quantity demanded of a good is to a change in its own price. It is calculated using the following formula:
PED=% change in price% change in quantity demanded
Because price and quantity typically move in opposite directions, the resulting value is usually negative. In business analysis, we often focus on the absolute value (the magnitude) to categorize demand into three types:
Elastic Demand ($|PED| > 1$): Consumers react strongly to price changes. This is common for luxury goods or branded items with many substitutes, such as restaurant meals or fashion brands.
Inelastic Demand ($|PED| < 1$): Consumers react minimally to price changes. This typically applies to necessities like essential medicines, electricity, or fuel.
Unit Elastic Demand ($|PED| = 1$): The percentage change in quantity is exactly equal to the percentage change in price.
Exam Tip: When calculating PED, always finish your calculation with an interpretation in words. For example, "Since $|PED| = 1.5$, demand is elastic, meaning consumers are relatively price-sensitive".
PED and Total Revenue
For a business manager, the most critical application of PED is understanding its impact on Total Revenue (Price×Quantity).
For elastic goods, increasing the price will actually reduce total revenue because the drop in sales volume is proportionately larger than the price gain.
For inelastic goods, increasing the price will increase total revenue because the drop in volume is proportionately smaller than the price rise.
Income Elasticity of Demand (YED)
YED measures how demand responds to changes in consumer income:
YED=% change in income% change in quantity demanded
The sign of the YED tells us the nature of the good:
Normal Goods ($YED > 0$): Demand rises as income rises. This includes necessities ($0 < YED < 1$) and luxury goods ($YED > 1$).
Inferior Goods ($YED < 0$): Demand falls as income rises (e.g., budget instant noodles).
Cross Elasticity of Demand (XED)
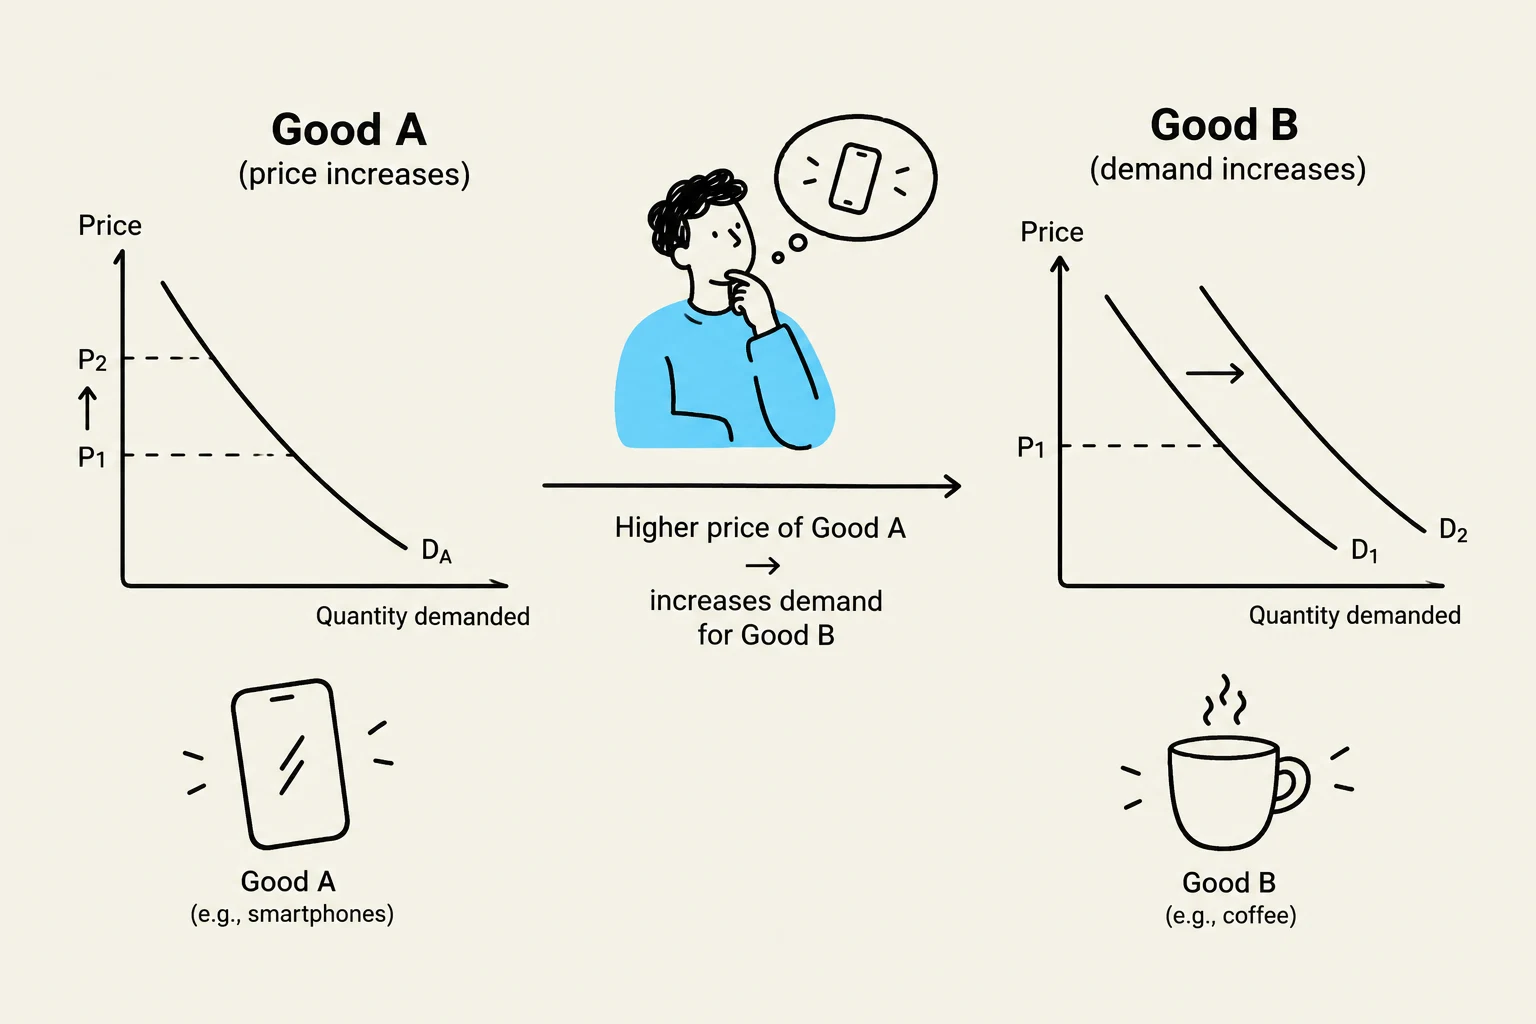
XED measures how the price change of one product affects the demand for another:
XED=% change in price of Product B% change in demand for Product A
Substitutes ($XED > 0$): Products that compete with each other, such as tea and coffee.
Complements ($XED < 0$): Products used together, such as printers and ink or cars and fuel.
Unrelated (XED≈0): Products with no significant relationship.
This diagram illustrates the economic concept of complementary goods, showing how an increase in the price of one good (Good A, e.g., smartphones) can lead to an increase in demand for another good (Good B, e.g., coffee).
Supply Responsiveness: Price Elasticity of Supply (PES)
Just as demand can be elastic, so can supply. Price Elasticity of Supply (PES) measures how strongly the quantity supplied responds to a change in price:
PES=% change in price% change in quantity supplied
Unlike PED, PES is normally positive because price and quantity supplied move in the same direction.
Elastic Supply ($PES > 1$): Firms can easily adjust output, perhaps due to spare capacity or available stock.
Inelastic Supply ($PES < 1$): Firms find it difficult to change output quickly, such as a farmer who cannot instantly grow more crops regardless of price increases.
A crucial determinant of PES is time. In the short run, supply is often inelastic because capacity (like factory size or land) is fixed. In the long run, supply becomes more elastic as firms can invest in new technology, build more facilities, or train more staff.
Market Growth and Business Strategy
Understanding these interconnected concepts allows firms to plan for market growth. Growth can be driven by increasing demand (e.g., rising incomes for normal goods) or improving supply conditions (e.g., technological advancements that lower costs).
When a market expands, managers must balance several factors:
Capacity Planning: Using PES to determine if they can scale output without losing quality.
Pricing Strategy: Using PED to decide whether to compete on high volume or high margins.
Investment: Using YED to forecast whether their product line is well-positioned for economic booms or downturns.
Summary Checklist: To master these topics, ensure you can define the concept, explain the economic mechanism, use a graph to illustrate the movement, and apply it to a real-world business scenario.
This graph illustrates the concept of supply and demand in economics, showing how an increase in supply can be caused by factors such as improved technology, lower production costs, more suppliers, and increased resource availability.
Keep reading for free.
Create an account to finish this reading and make it part of your study routine.