An explanation of hypothesis testing, including null and alternate hypotheses, p-values, statistical significance, and the risks of Type I and Type II errors. It also covers confidence intervals for estimating effect size and precision.
In the world of clinical research, we rarely possess absolute certainty. Instead, we engage in an "estimation of the truth". Because we study samples rather than entire populations, we must use statistical frameworks to determine whether the differences we observe in our data are real effects or simply the result of random chance. This process is known as hypothesis testing.
The Framework: Null and Alternate Hypotheses
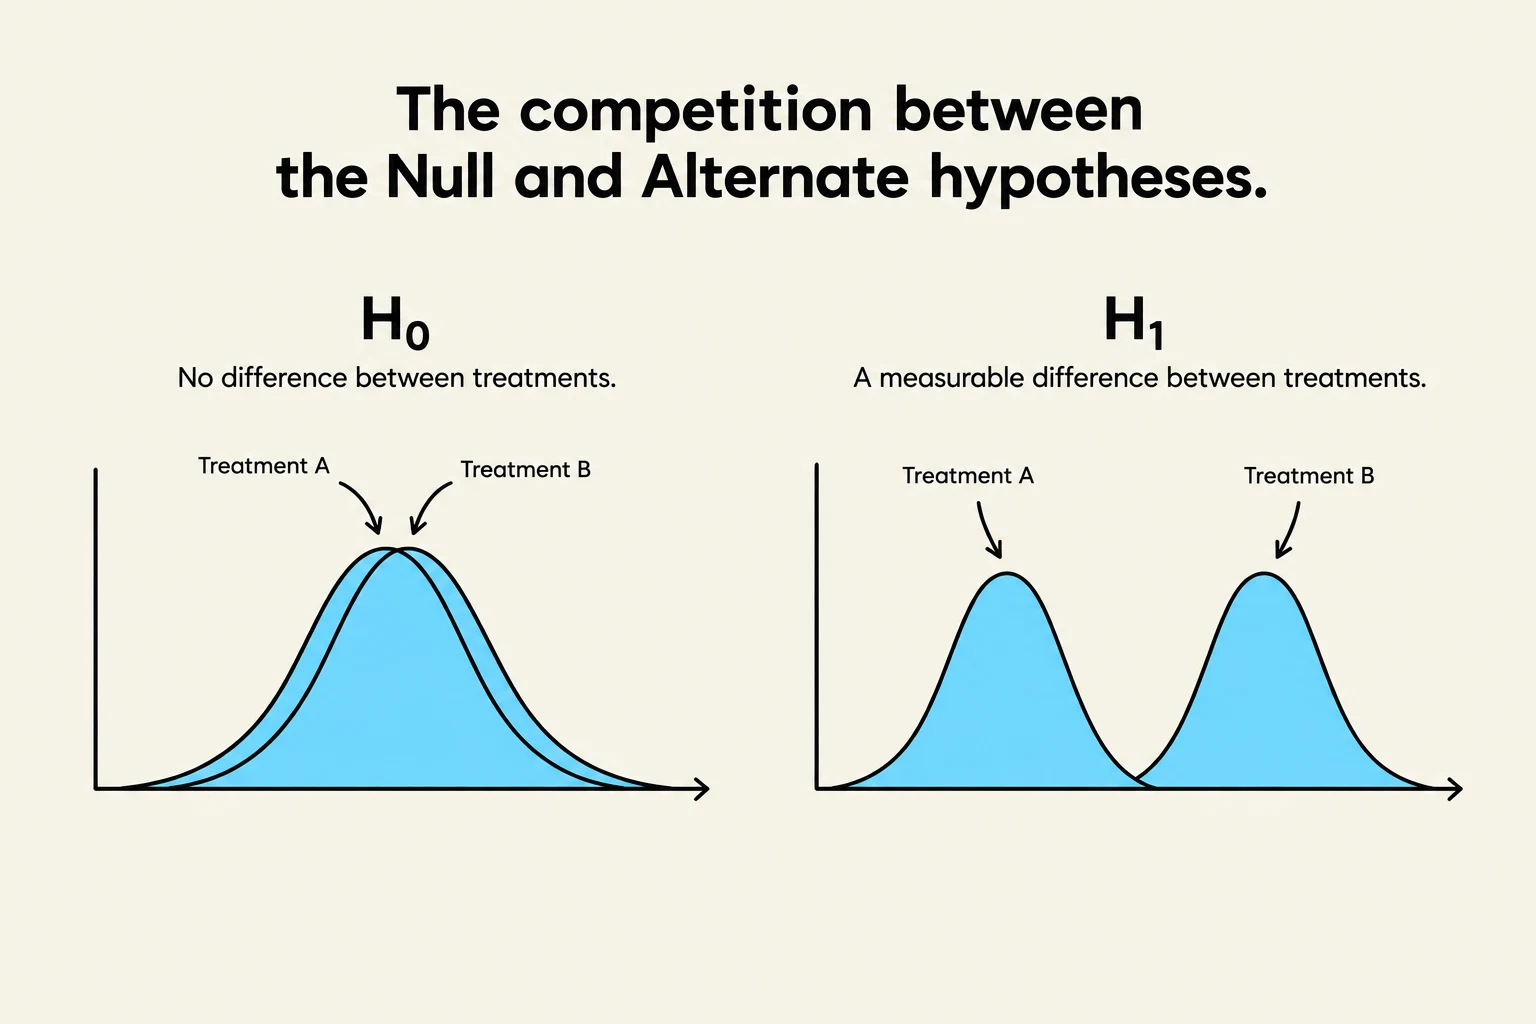
This illustration depicts the competition between the Null (H0) and Alternate (H1) hypotheses in statistical testing. H0 suggests no difference between treatments, represented by overlapping distributions. H1 suggests a measurable difference, shown by distinct distributions for Treatment A and Treatment B.
Hypothesis testing is built upon a competition between two opposing statements. To test a clinical intervention—for example, comparing Treatment A versus Treatment B in individuals with lumbar stenosis—we must define both the status quo and the proposed change.
The Null Hypothesis (H0)
The Null Hypothesis (H0) is the starting assumption that there is no effect, no difference, or no relationship between the variables being studied. In a clinical trial, H0 would state that Treatment A and Treatment B produce the same results in patients.
The Alternate Hypothesis (H1)
The Alternate Hypothesis (H1) is the statement we are actually testing for. It proposes that there is a statistically significant difference or an effect present. If our data provides strong enough evidence to suggest that the null hypothesis is unlikely to be true, we move toward accepting the alternate hypothesis.
Quantifying Evidence: The p-value and Statistical Significance
Once we have collected our data, we need a way to measure how much evidence we have against the null hypothesis. This is where the p-value becomes essential.
The p-value represents the probability that the observed results (or more extreme results) occurred by pure chance, assuming that the null hypothesis is actually true.
Interpreting p-values
A smaller p-value indicates stronger evidence against the null hypothesis. It tells us that the observed difference is very unlikely to have happened due to random error alone.
High p-value: A p-value of 0.70 suggests a very high probability that the results are due to chance; therefore, the difference is not statistically significant.
Low p-value: A p-value of 0.005 suggests a much stronger case for a real effect, making the result statistically significant.
Exam Tip: Comparing Magnitudes
When comparing two small p-values, remember that the smaller the number, the more "significant" the result. For example, a p-value of 0.004 is considered less statistically significant than a p-value of 0.002, because 0.002 represents an even lower probability of the result being caused by random error.
The Risks of Error: Type I and Type II
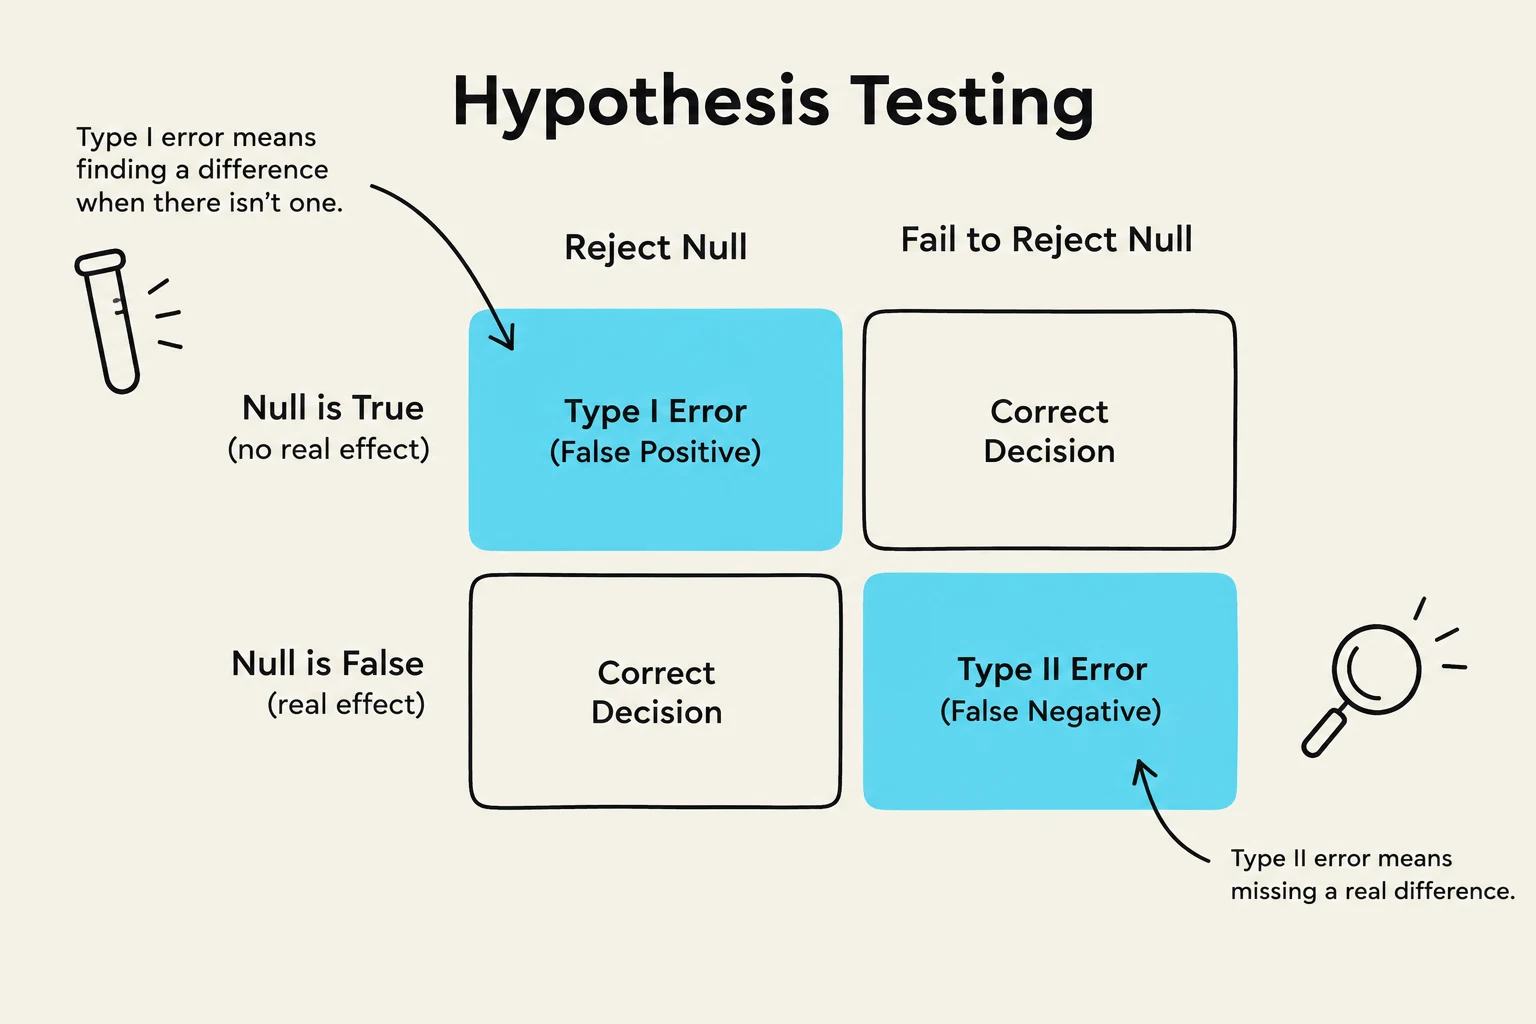
This diagram illustrates the outcomes of hypothesis testing, distinguishing between Type I and Type II errors, and correct decisions, based on whether the null hypothesis is true or false.
Statistical decision-making is never perfect. Because we are making inferences about a population based on a sample, we run the risk of making incorrect conclusions.
Type I Error: This occurs when we incorrectly reject a true null hypothesis. In clinical terms, this is a "false positive"—concluding that a treatment works when it actually does not.
Type II Error: This occurs when we fail to reject a false null hypothesis. This is a "false negative"—concluding there is no effect when a real difference actually exists.
Moving Beyond the p-value: Confidence Intervals
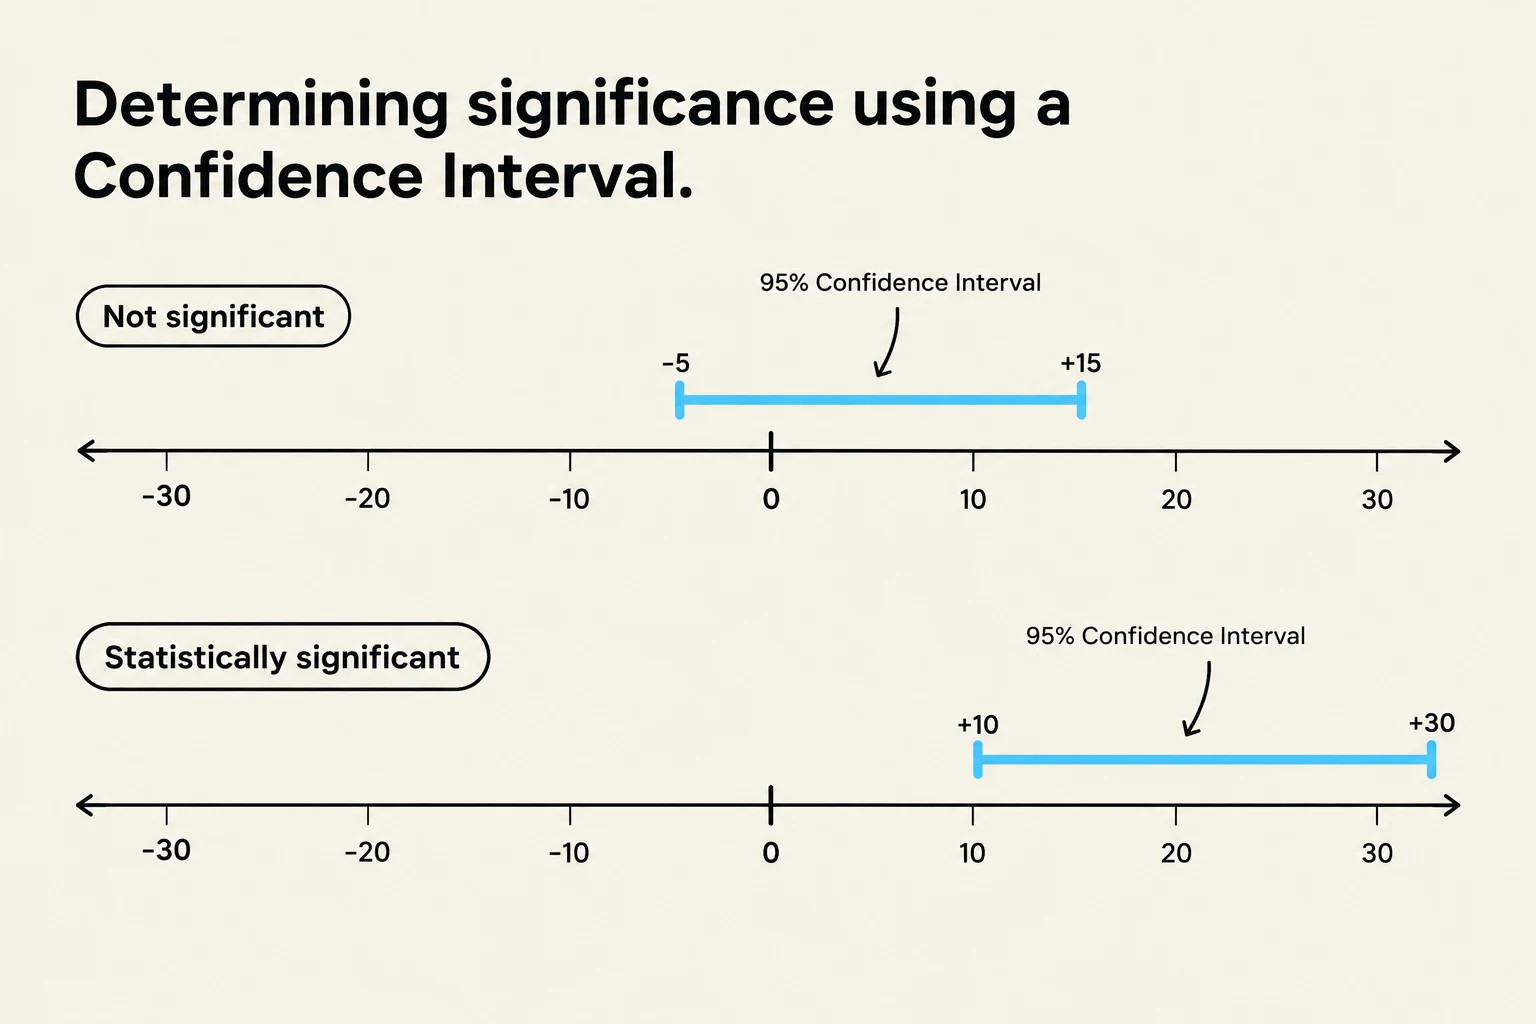
This illustration demonstrates how confidence intervals are used to determine statistical significance. A confidence interval that includes zero is considered not significant, while an interval that does not include zero is statistically significant.
While the p-value tells us if an effect exists, it doesn't tell us how large that effect is or how precise our estimate is. To gain a more complete picture, researchers use the Confidence Interval (CI).
A Confidence Interval provides a range of plausible values for the true effect in the population. A common standard is the 95% Confidence Interval (CI95%).
Example: Clinical Application
Consider a study comparing Treatment A and Treatment B in patients with shoulder osteoarthritis. The study finds that patients on Treatment A had 20∘ more shoulder flexion than those on Treatment B, with a $95%$ Confidence Interval of 10∘ to 30∘.
What if we don't have a p-value?
Even without a direct p-value, we can determine statistical significance by looking at the CI:
If the interval does not include zero, it suggests a statistically significant difference exists.
In the example above, since the entire range (10 to 30) is above zero, we can conclude there is a statistically significant difference between the treatments.
By combining the p-value (to determine significance) and the Confidence Interval (to determine magnitude and precision), clinicians can better interpret both the statistical reliability and the clinical relevance of research findings.
This article is based on materials from DPT 6230 Module 2.
Keep reading for free.
Create an account to finish this reading and make it part of your study routine.