A tutorial covering the construction and interpretation of histograms, box-whisker plots, and frequency distributions, including concepts like relative frequency and quartiles.
When analyzing a dataset, simply looking at a list of numbers rarely tells the whole story. To understand the "shape" of your data—whether it is clustered in the middle, spread out, or skewed to one side—you need visual tools. This tutorial covers two of the most fundamental tools in statistics: the Histogram and the Box-Whisker Plot.
Understanding Frequency Distributions
Before we can draw charts, we must organize raw data into a structured format. This is known as a frequency distribution. A frequency distribution is essentially a summary of how often each value (or range of values) occurs in a dataset.
When dealing with continuous data, such as the diameter of nanoparticles or blood pressure, we cannot list every single unique value. Instead, we group the data into "bins" or intervals.
Types of Frequency Representations
There are three main ways to express these distributions:
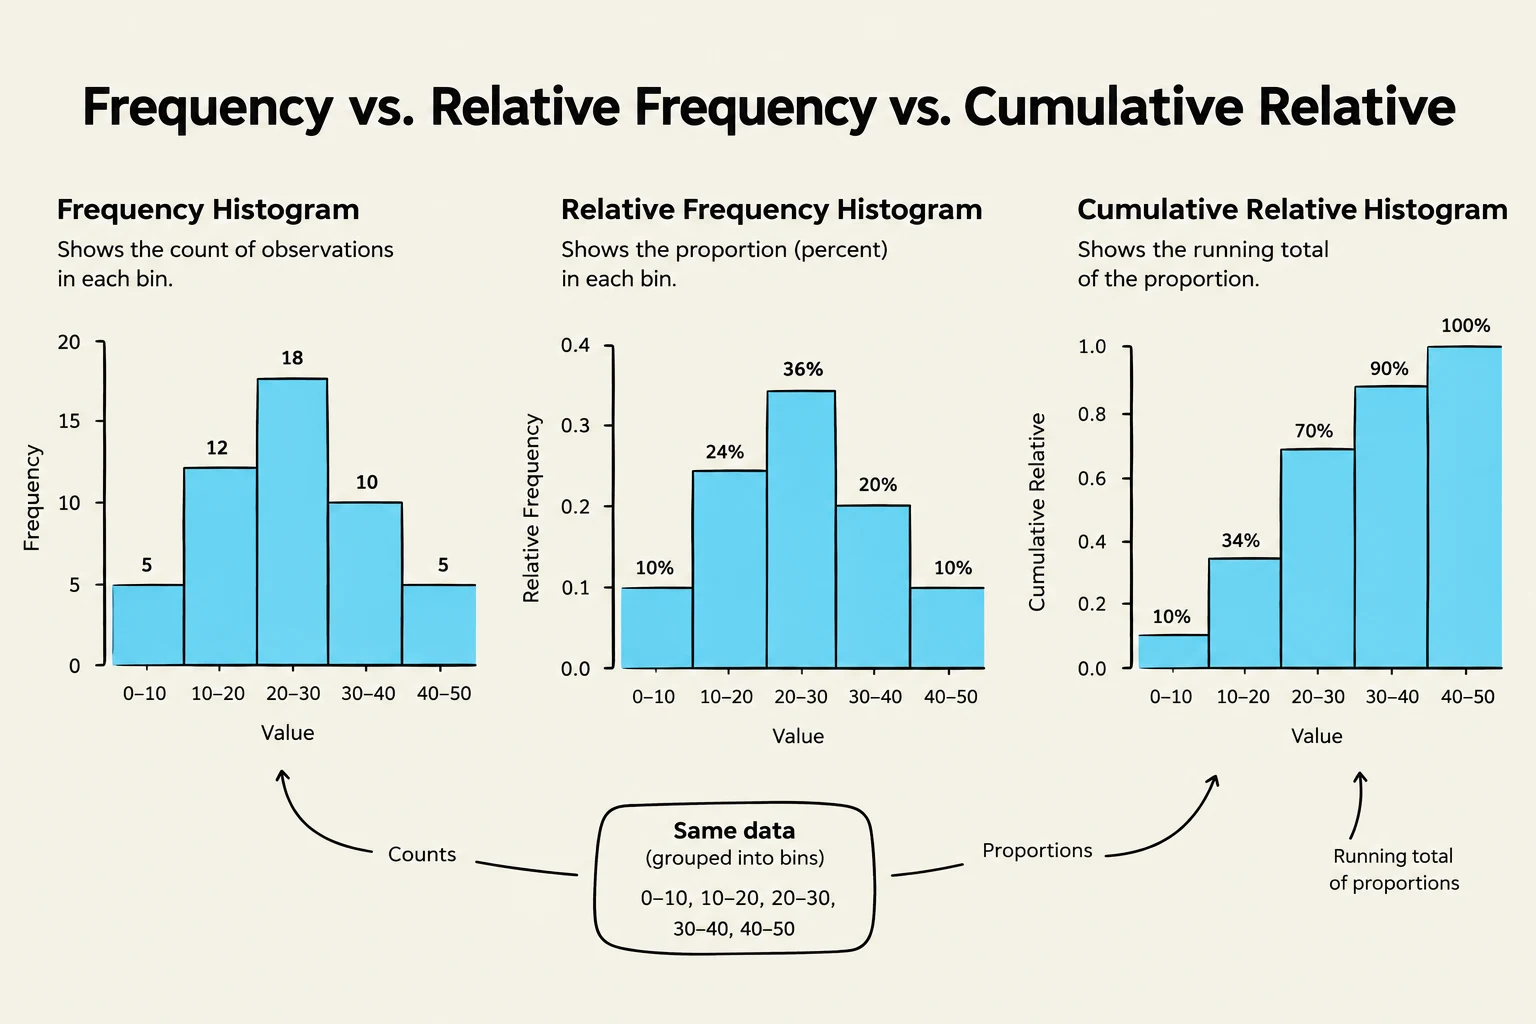
Frequency (Number Distribution): This is the raw count of how many data points fall into each bin.
Relative Frequency: Instead of raw counts, we use proportions or percentages. To calculate this, you divide the frequency of a specific bin by the total number of observations (N):
Relative Frequency=Total Number of ObservationsFrequency of Bin
Cumulative Relative Frequency: This represents the running total of the relative frequencies. It shows the proportion of data points that are less than or equal to a certain value.
This illustration displays three types of histograms: frequency, relative frequency, and cumulative relative frequency, all derived from the same dataset grouped into bins. The frequency histogram shows the count of observations in each bin, while the relative frequency histogram illustrates the proportion (percentage) of observations in each bin. The cumulative relative frequency histogram presents the running total of these proportions.
The Histogram
A histogram is a graphical representation of a frequency distribution. It consists of adjacent rectangles (bins) where the area of each rectangle is proportional to the frequency of the values it represents.
How to Interpret a Histogram
Shape: Is the data symmetrical (like a bell curve) or skewed? If the "tail" of the graph stretches far to the right, it is positively skewed; if to the left, it is negatively skewed.
Center: You can visually estimate where the bulk of the data lies.
Spread: The width of the histogram shows the range of the data.
Exam Tip: When asked to find a percentage from a histogram, remember that the total area of all bars equals 1 (or 100%). If you need to find the percentage of women with blood pressure above 130 mm, sum the heights (or areas) of all bars starting from the 130 mm mark.
The Box-Whisker Plot
While histograms are great for seeing the overall shape, the box-whisker plot (or simply boxplot) is superior for identifying specific statistical markers like the median and outliers.
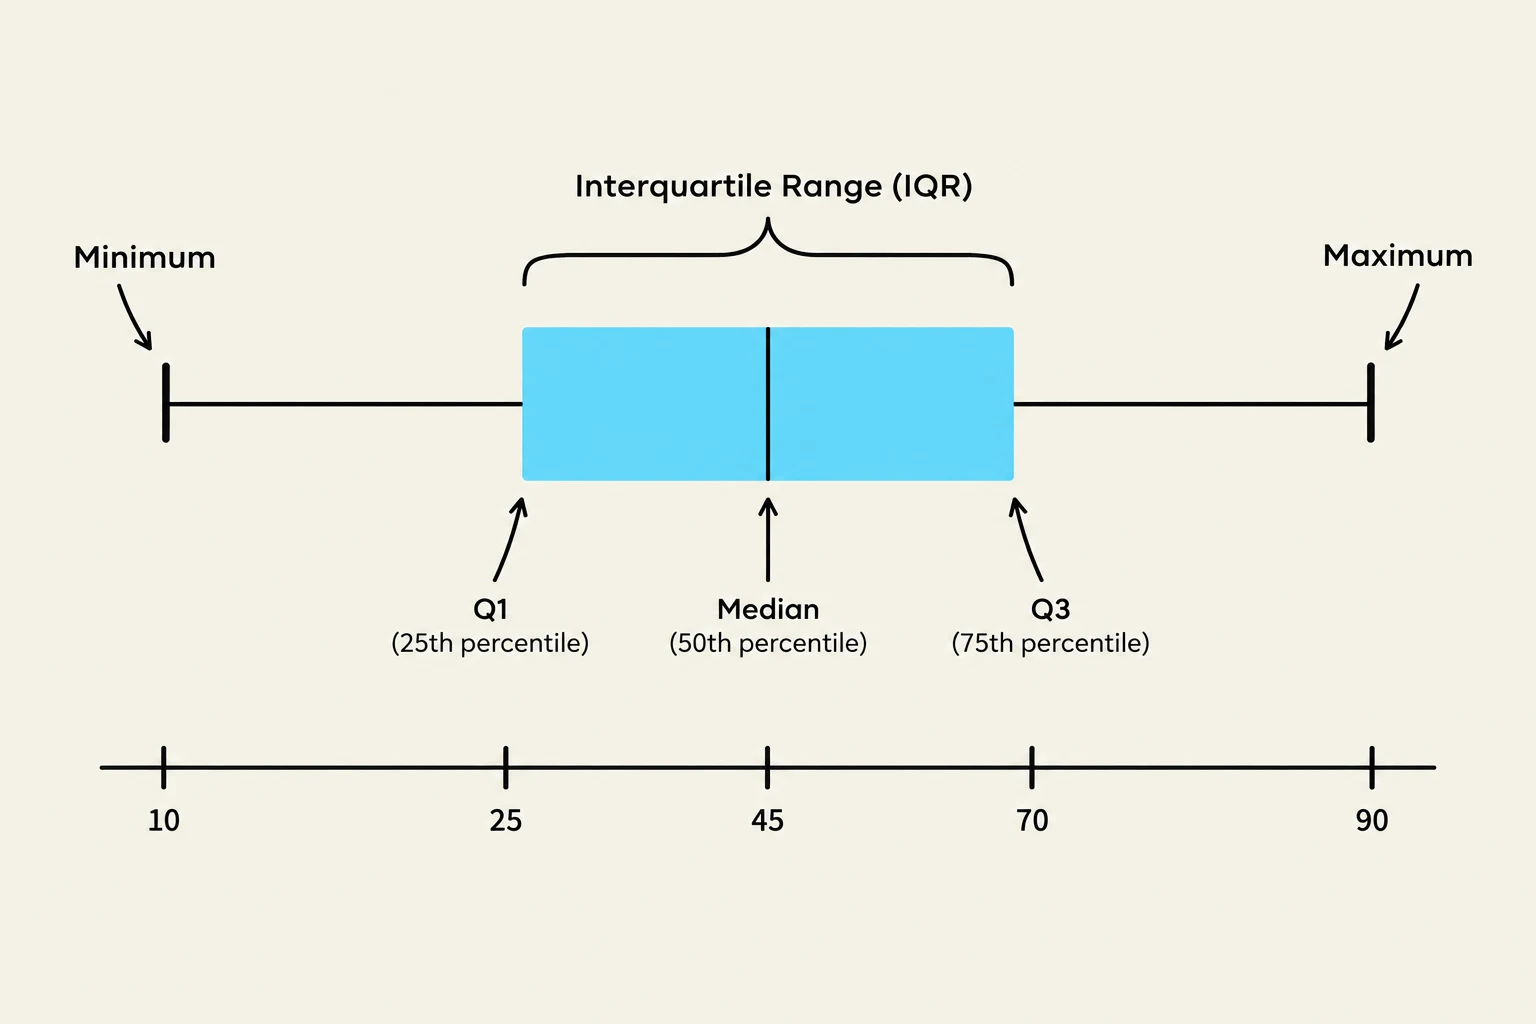
A boxplot divides your data into four equal parts using quartiles:
First Quartile (Q1): The 25th percentile.
Median (Q2): The middle value of the dataset.
Third Quartile (Q3): The 75th percentile.
Key Components of the Plot
The "box" is drawn from Q1 to Q3. The length of this box is known as the Interquartile Range (IQR), which represents the middle 50% of your data:
IQR=Q3−Q1
Extending from the box are the whiskers. These lines represent the spread of the data outside the middle 50%.
A box plot illustrating statistical measures including minimum, first quartile (Q1), median, third quartile (Q3), and maximum, with the interquartile range (IQR) highlighted.
Important Note on Whiskers: There is often confusion regarding the length of whiskers. In many standard constructions, the whiskers extend to the furthest data points that fall within 1.5×IQR from the quartiles. This means the length of the whiskers is not always exactly 1.5×IQR; it can be less than that value depending on where the actual data points lie.
Comparing Summary Statistics
One of the most powerful uses of these tools is comparing the mean (average) and the median (middle value).
In a perfectly symmetrical distribution, the mean and median are equal. However, in skewed distributions, they diverge:
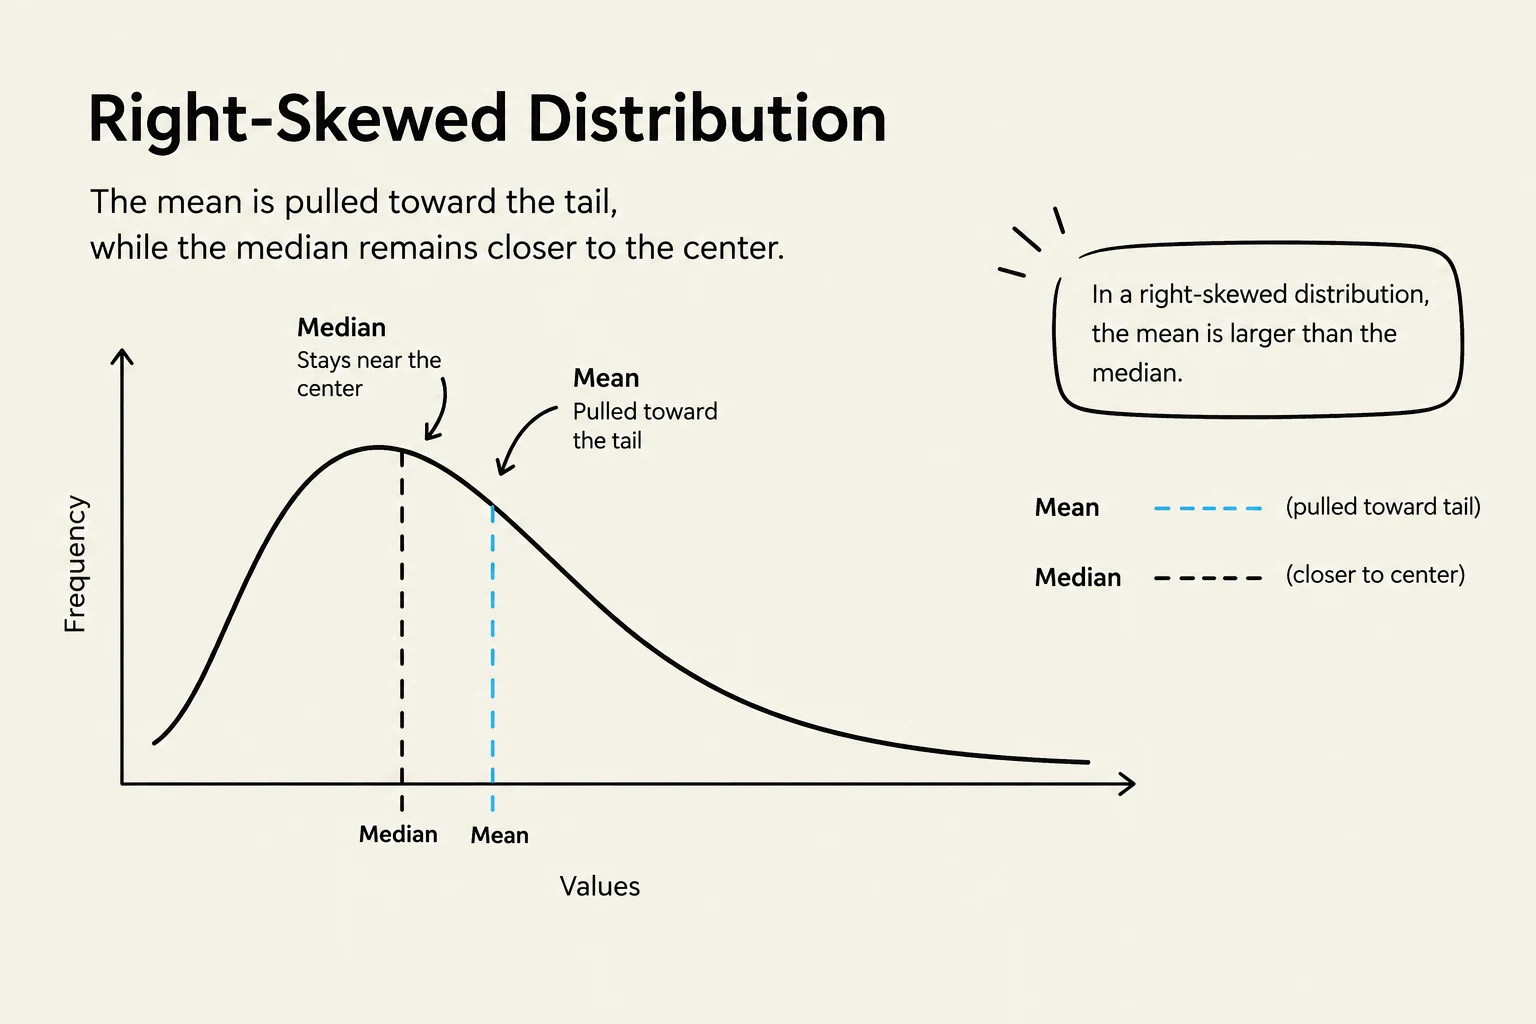
Right Skewed (Positive Skew): The mean is typically greater than the median because high-value outliers pull the mean upward.
Left Skewed (Negative Skew): The mean is typically less than the median.
Robustness: Mean vs. Median
When you have a dataset with extreme outliers—such as a company where most employees earn £25,000 but the CEO earns £200,000—the mean will be significantly inflated and may not represent a "typical" salary.
The median is considered a robust statistic because it is not heavily influenced by extreme values at the edges of the distribution. In the example of salaries, the median would remain near £25,000, providing a much more accurate picture of what a standard employee earns.
A right-skewed distribution graph illustrating that the mean is pulled toward the tail, while the median remains closer to the center.
Summary Table: Histogram vs. Box Plot
Feature
Histogram
Box Plot
Best For
Visualizing the "shape" and modality (peaks)
Visualizing quartiles and outliers
Data Grouping
Uses bins/intervals
Uses quartiles
Outlier Detection
Harder to see precisely
Very easy to identify
Summary Stats
Hard to pinpoint exact median
Clearly displays median and IQR
Keep reading for free.
Create an account to finish this reading and make it part of your study routine.