


In the study of engineering mathematics, particularly within maritime and electro-technology disciplines, understanding the relationship between exponential and logarithmic functions is essential. While exponential functions model rapid growth or decay, logarithmic functions serve as their mathematical inverse. By mastering the graphical properties of these functions, engineers can better model and solve complex real-world problems, such as the cooling of a marine boiler or the resistance in an electrical circuit.
Logarithmic Function Graphs
A logarithmic function is defined as the inverse of an exponential function. If we have an exponential function of the form , its inverse is the logarithmic function .
A key geometric property of inverse functions is that their graphs are reflections of one another across the line . This means that if you know the shape of an exponential curve, you can determine the shape of the corresponding logarithmic curve by flipping it over this diagonal axis.
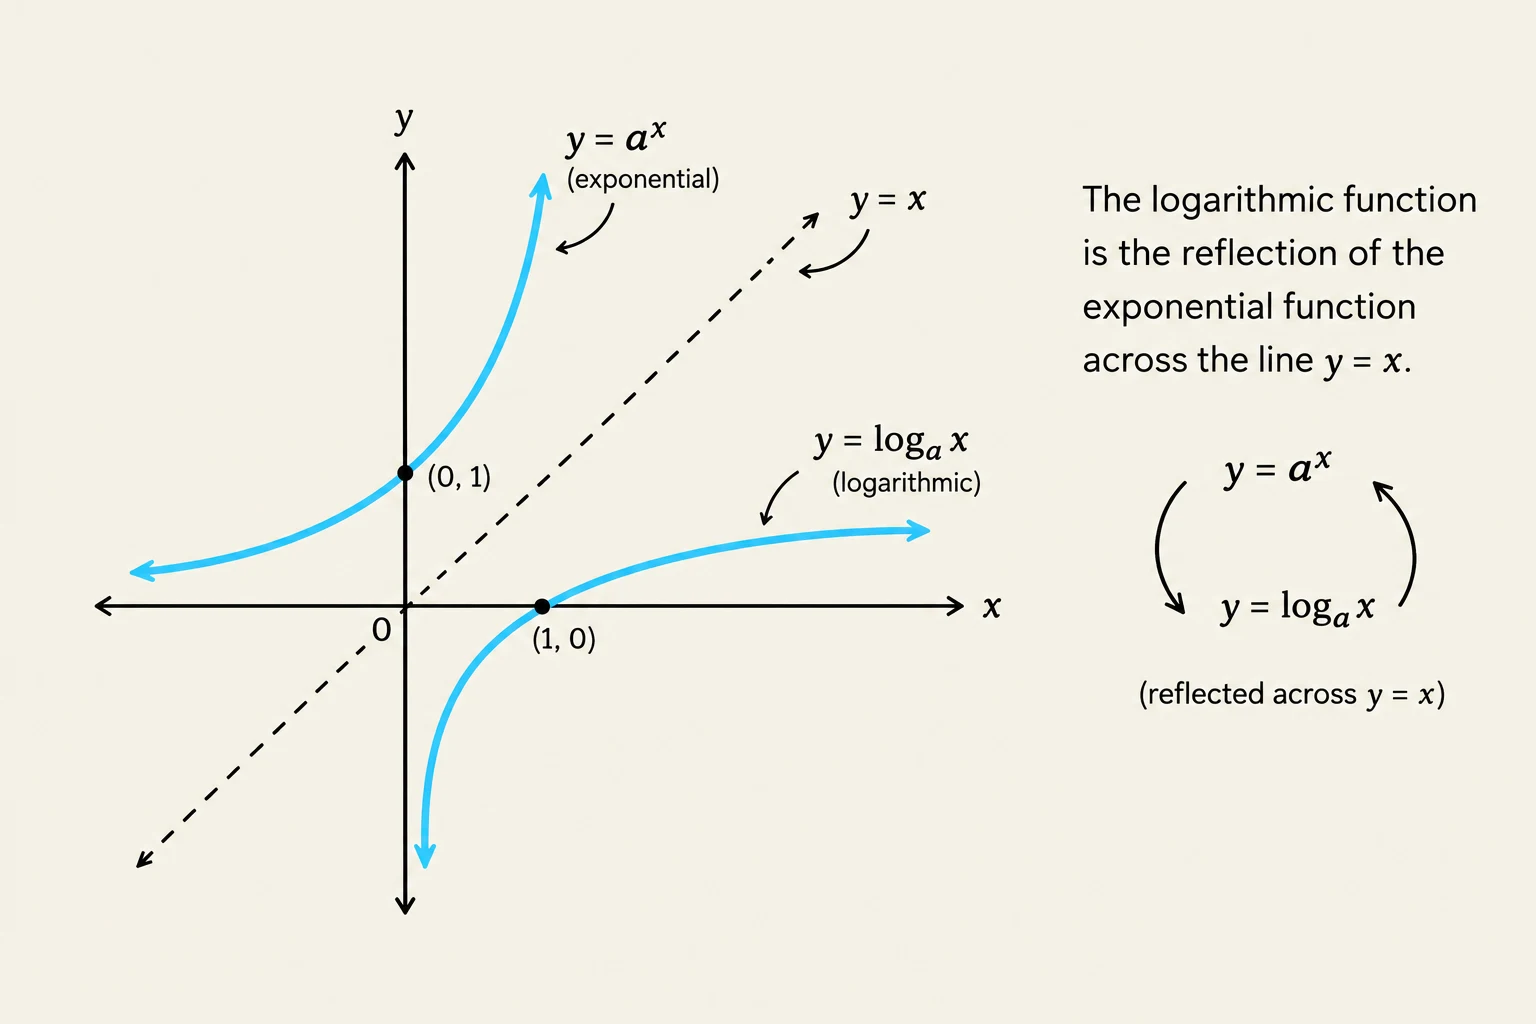
Common logarithmic functions include the common logarithm (base 10), written as , and the natural logarithm (base ), written as (or ). Despite having different bases, these graphs share very similar structural features.

Keep reading for free.
Create an account to finish this reading and make it part of your study routine.
Continue reading freeAlready have an account? Log in
Updated