Government Intervention in Markets: Taxes, Subsidies, and Regulations
Explore how governments intervene in free markets through taxes, subsidies, price controls, and quantity regulations. Understand tax incidence, elasticity's role, and the impact on market equilibrium, shortages, and surpluses.
In a free market, the forces of supply and demand interact to determine the price and quantity of goods sold. However, governments often intervene in these markets through laws, regulations, taxes, and subsidies to shape the costs and benefits of economic decisions. Whether the goal is to reduce the consumption of unhealthy goods (like sugary drinks) or to encourage beneficial behaviors (like education or childcare), these interventions fundamentally alter market outcomes by shifting supply and demand curves.
Understanding Tax Incidence: Who Really Pays?
When the government imposes a tax, it creates a wedge between the price buyers pay and the price sellers receive. To understand who bears this cost, we must distinguish between two critical concepts:
Statutory Burden: The legal obligation assigned by the government to a specific party to send the tax payment.
Economic Burden (Tax Incidence): The actual division of the tax cost between buyers and sellers based on changes in the prices they face.
A common misconception is that the statutory burden determines who pays the tax. In reality, the tax incidence does not depend on whether the tax is legally levied on the buyer or the seller. Whether the government taxes the seller or the buyer, the end result for the market equilibrium—the final price paid by consumers and the final price received by producers—is identical.
The Role of Price Elasticity
The most important factor in determining tax incidence is price elasticity. Elasticity measures how responsive buyers or sellers are to changes in price. The fundamental rule is: The more inelastic party bears more of the tax burden.
Inelastic Demand: If buyers are relatively unresponsive to price changes (a steeper demand curve), they will bear a larger share of the tax because they cannot easily switch to alternatives.
Inelastic Supply: If sellers are relatively unresponsive to price changes (a steeper supply curve), they will bear a larger share of the tax.
Exam Tip: To determine tax incidence, look at the curves. The "steeper" curve represents the more inelastic party, and that party will always pay more of the tax.
Worked Example: The Soda Tax
Consider a $0.30 tax on soda. If the tax is placed on sellers, it is viewed as a rise in the marginal cost of production. Since the supply curve represents the marginal cost curve, the supply curve shifts upward by $0.30.
This graph illustrates the economic concept of supply and demand, showing how a shift in supply affects the equilibrium price and quantity of soda.
This shift results in a new equilibrium where the quantity sold decreases. Even if the tax was legally on the seller, the buyers might end up paying more. For instance, if the original price was $1.10, the new price buyers pay might be $1.30 (a $0.20 increase), while the price sellers receive drops to $1.00 (a $0.10 decrease). In this case, the tax incidence on buyers is:
0.300.20=66.7%
Conversely, if demand were highly elastic (a flatter curve), the buyers' share of the tax would drop significantly, leaving the sellers to bear most of the burden.
Subsidies: The "Negative Tax"
A subsidy is a payment made by the government to encourage a specific choice. You can think of a subsidy as a "negative tax"—it operates with the opposite sign of a tax. While taxes decrease quantities and increase the price gap between buyers and sellers, subsidies increase the quantity traded and lower the price for buyers while increasing the price received by sellers.
Assessing Subsidy Impact
To analyze a subsidy, follow these steps:
Identify which curve shifts (demand or supply) based on who receives the subsidy.
Determine if the shift is an increase or decrease in marginal benefit or cost.
Find the new equilibrium quantity and prices.
Use elasticity to see who benefits most.
Just like taxes, the economic benefit of a subsidy is shared, and the more inelastic party captures more of the benefit.
Example: Child Care Subsidies
If the government provides a $$3,000$ subsidy to parents for childcare, this increases the marginal benefit of childcare, shifting the demand curve upward (to the right). This leads to an increase in the equilibrium quantity of children in childcare. The benefit is shared: parents pay less, and childcare providers receive more, but the distribution depends on the relative elasticities of the market.
Price and Quantity Regulations
Beyond taxes and subsidies, governments use direct regulations to control market outcomes. These are categorized into price regulations and quantity regulations.
Price Regulations: Ceilings and Floors
Price Ceilings are maximum prices set by the government.
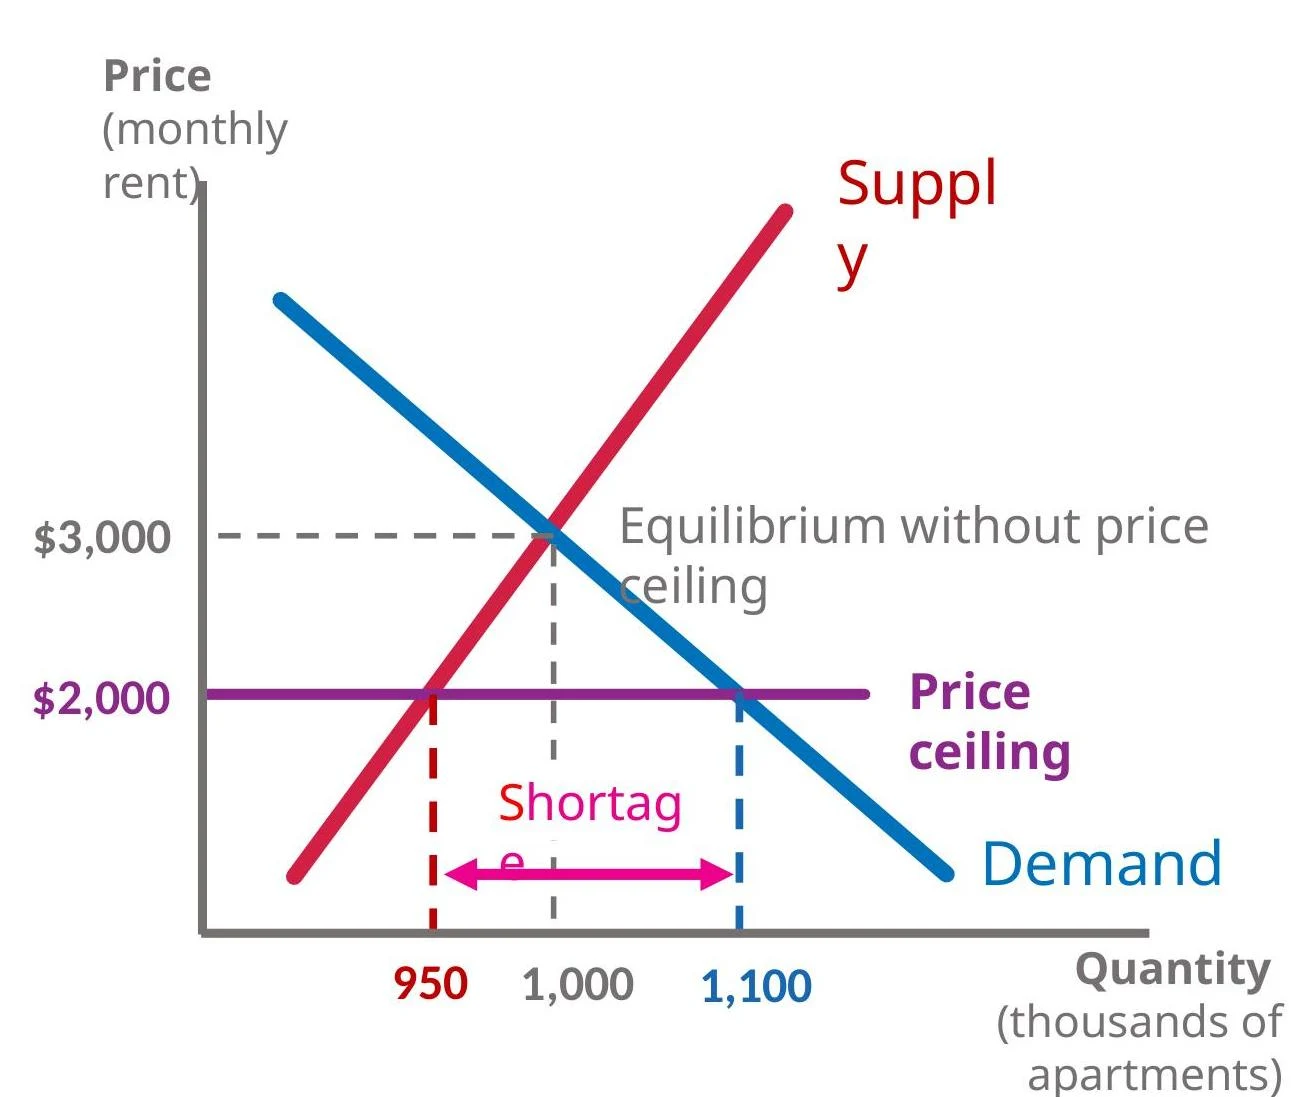
A binding price ceiling must be set below the equilibrium price to have any effect.
Consequence: A binding ceiling (like rent control) creates a shortage, as the quantity demanded exceeds the quantity supplied.
This graph illustrates the economic concept of a price ceiling in the rental market. The demand and supply curves intersect at an equilibrium price of $3,000. A price ceiling set at $2,000 creates a shortage, as the quantity demanded exceeds the quantity supplied at that lower price.
Price Floors are minimum prices set by the government.
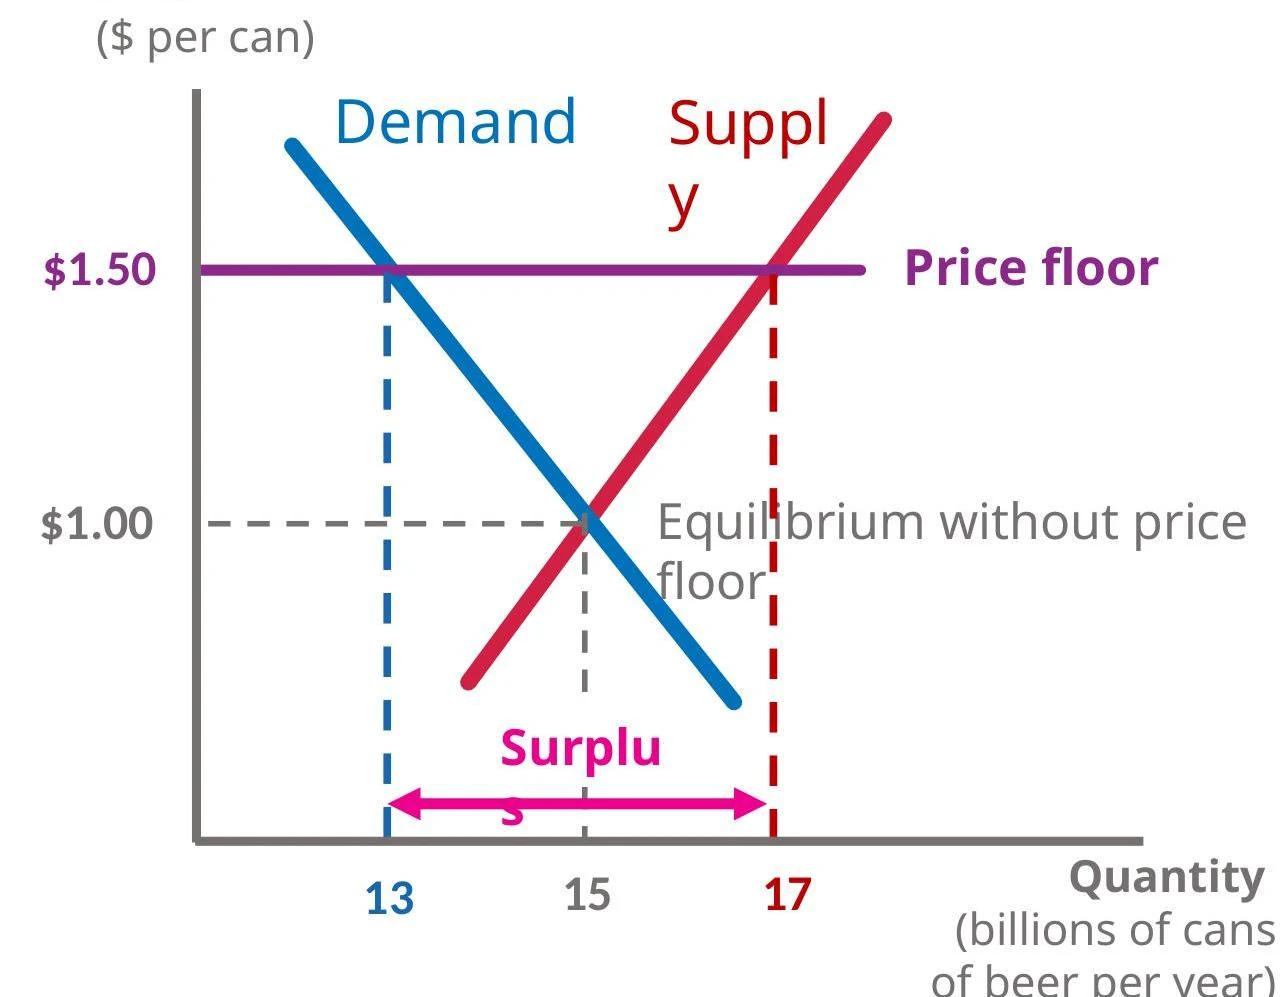
A binding price floor must be set above the equilibrium price.
Consequence: A binding floor (like minimum wage or alcohol price floors) creates a surplus, as the quantity supplied exceeds the quantity demanded.
This graph illustrates the economic concept of a price floor, showing how it creates a surplus when set above the equilibrium price. The demand and supply curves intersect at the equilibrium point, but the price floor prevents the market from reaching this equilibrium, leading to an excess of supply over demand.
Quantity Regulations: Mandates and Quotas
Quantity regulations limit the amount of a good that can be traded.
Mandate: A requirement to buy or sell a minimum amount. A binding mandate is set at a quantity greater than the equilibrium quantity, effectively increasing the market size.
Quota: A limit on the maximum quantity that can be bought or sold. A binding quota is set at a quantity less than the equilibrium quantity, effectively decreasing the market size.
The top graph illustrates a binding price mandate, showing supply and demand curves with a mandated price above market equilibrium. The bottom graph depicts a binding quota, where a quantity restriction is imposed below market equilibrium.
Summary Table: Regulation Comparison
Regulation Type
Binding Condition
Market Result
Price Ceiling
Set below equilibrium
Shortage
Price Floor
Set above equilibrium
Surplus
Mandate
Set above equilibrium quantity
Increased Quantity
Quota
Set below equilibrium quantity
Decreased Quantity
Keep reading for free.
Create an account to finish this reading and make it part of your study routine.