Explains the economic concept of demand, including the law of demand, individual vs. market demand, factors influencing demand, and the distinction between movements along and shifts of the demand curve.
In the study of economics, understanding how buyers behave is essential to understanding how markets function. At the heart of this behavior lies the concept of demand. While we often use the word "demand" colloquially to mean "wanting" something, in economics, it has a very specific definition that links human desire to the practical ability to pay.
Understanding Demand and the Law of Demand
Demand represents the quantity that buyers are willing and able to purchase at every possible price. It is important to note that "willingness" alone is not enough; a consumer must also have the "ability" (the financial means) to complete the purchase.
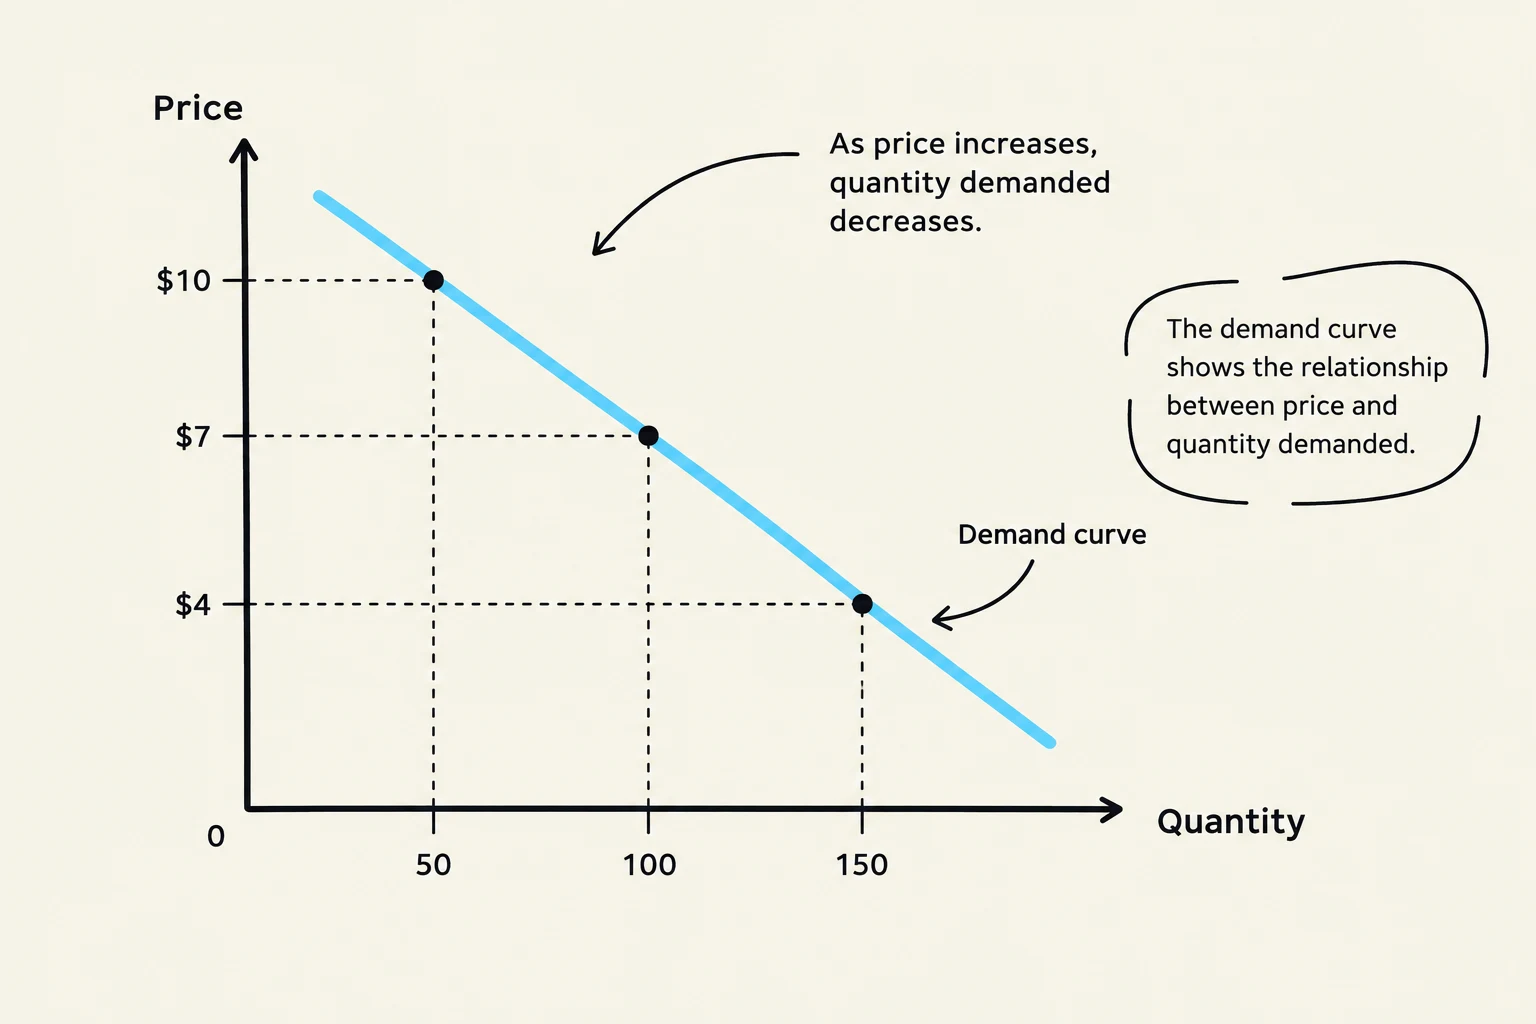
The relationship between price and the quantity people want to buy is described by the Law of Demand. This law states that, all else being equal (ceteris paribus), the quantity demanded falls as the price increases. Because of this inverse relationship—where price goes up and quantity goes down—the demand curve is graphically represented with a negative slope.
A demand curve illustrates the inverse relationship between the price of a good and the quantity demanded by consumers.
Exam Tip: When you see a question about the Law of Demand, always look for the phrase "ceteris paribus" or "all else equal." This means we are assuming that no other factors (like income or tastes) are changing at the same time we are looking at the price change.
Individual vs. Market Demand
Economists distinguish between what a single person wants and what an entire population wants.
Individual Demand focuses on a single consumer. It answers the question: "At different prices, how many units are you personally willing to buy?".
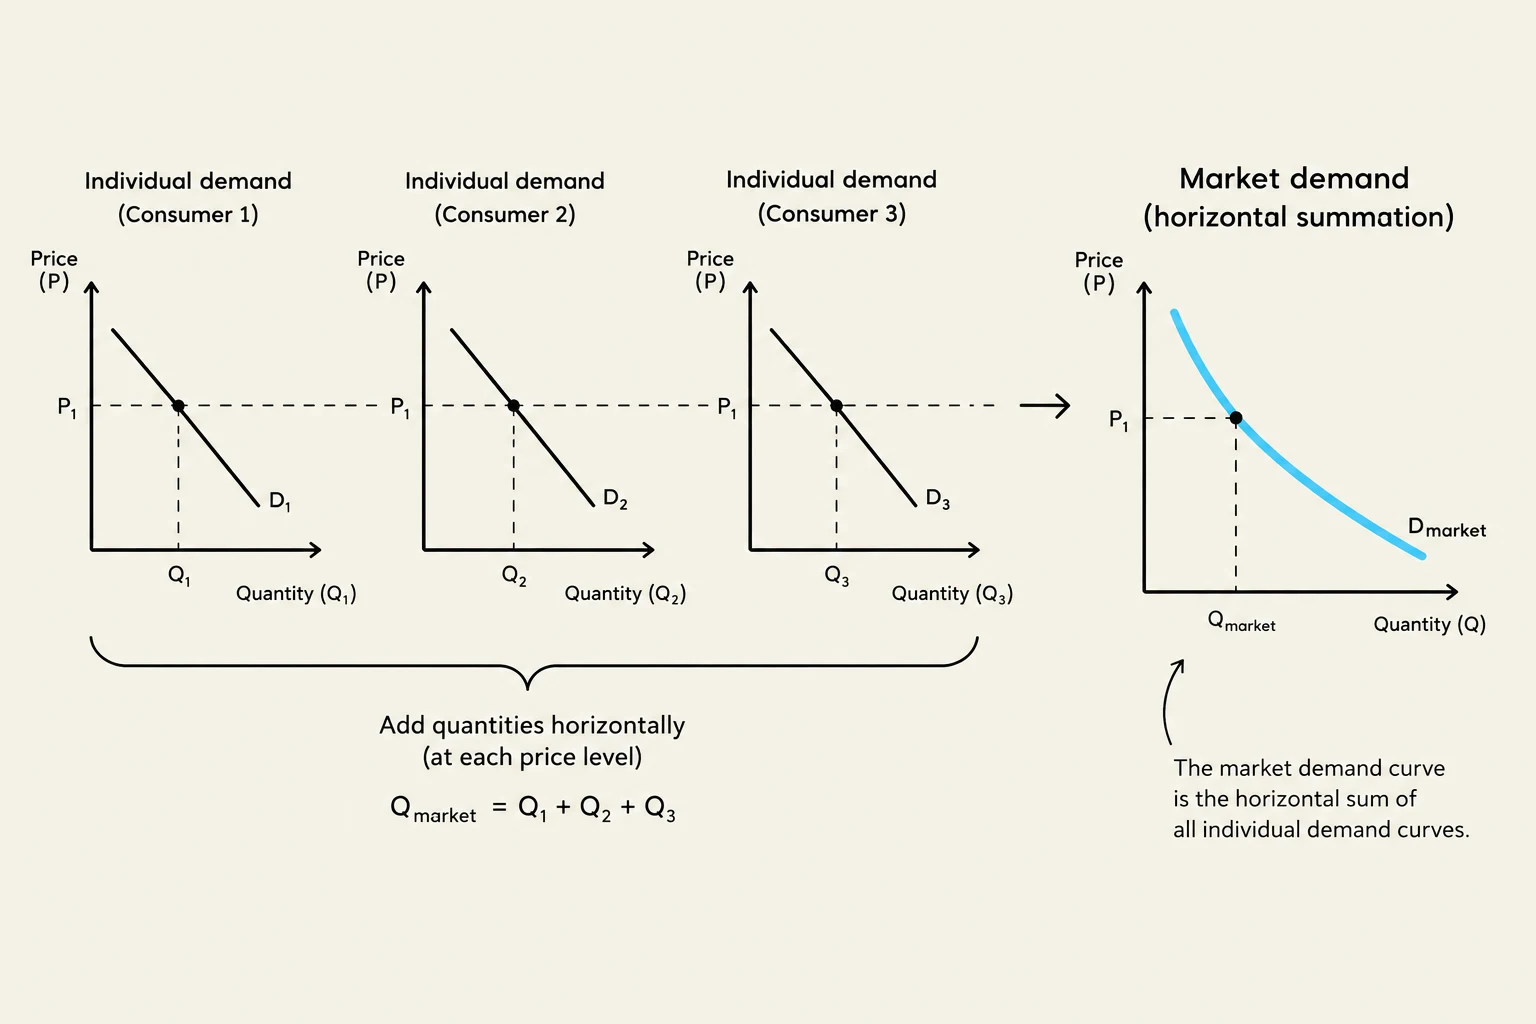
Market Demand is the sum of all individual demands within a specific market. To find the market demand, economists use a process called "horizontal summation." This means that for every possible price point, you add up the quantities demanded by every individual in the market.
In practice, researchers often estimate market demand using these steps:
Run a survey to obtain many individual demands.
For each price point, add up the total quantity requested by all surveyed customers.
Scale up those quantities to represent the entire market (since a survey is only a subset of the population).
Draw the resulting market demand curve.
This diagram illustrates how individual demand curves are horizontally summed to create a market demand curve. At any given price level, the total market quantity demanded is the sum of the quantities demanded by each individual consumer.
Factors That Shape Demand
The position and shape of a demand curve are not static. While the good's own price is a primary factor, several other variables can change how much people want to buy.
Income: Normal vs. Inferior Goods
A consumer's income level significantly impacts their demand. However, not all goods react to income in the same way:
Normal Goods: Demand increases when consumer income increases.
Inferior Goods: Demand decreases when consumer income increases (for example, a person might buy fewer instant noodles if they suddenly earn a much higher salary).
Related Goods: Substitutes and Complements
The price of one good can change the demand for another. We categorize these relationships into two types:
Substitutes: These are goods that can be used in place of one another (like tea and coffee). If the price of a substitute increases, the demand for your product will likely increase.
Complements: These are goods that are used together (like printers and ink cartridges). If the price of a complement increases, the demand for your product will likely decrease.
Other factors that influence the demand curve include consumers' tastes or preferences, the number of buyers in the market, and consumer expectations about the future.
Movement Along the Curve vs. Shifts in Demand
One of the most common mistakes in economics is confusing a "change in quantity demanded" with a "change in demand."
Movement Along the Demand Curve
A movement along the demand curve occurs only when the price of the good itself changes.
If the price decreases, the quantity demanded increases.
If the price increases, the quantity demanded decreases.
Crucial Distinction: In these cases, demand does not change. We say there is a change in "quantity demanded," not a change in "demand." Quantity demanded = demand.
Shifts in the Demand Curve
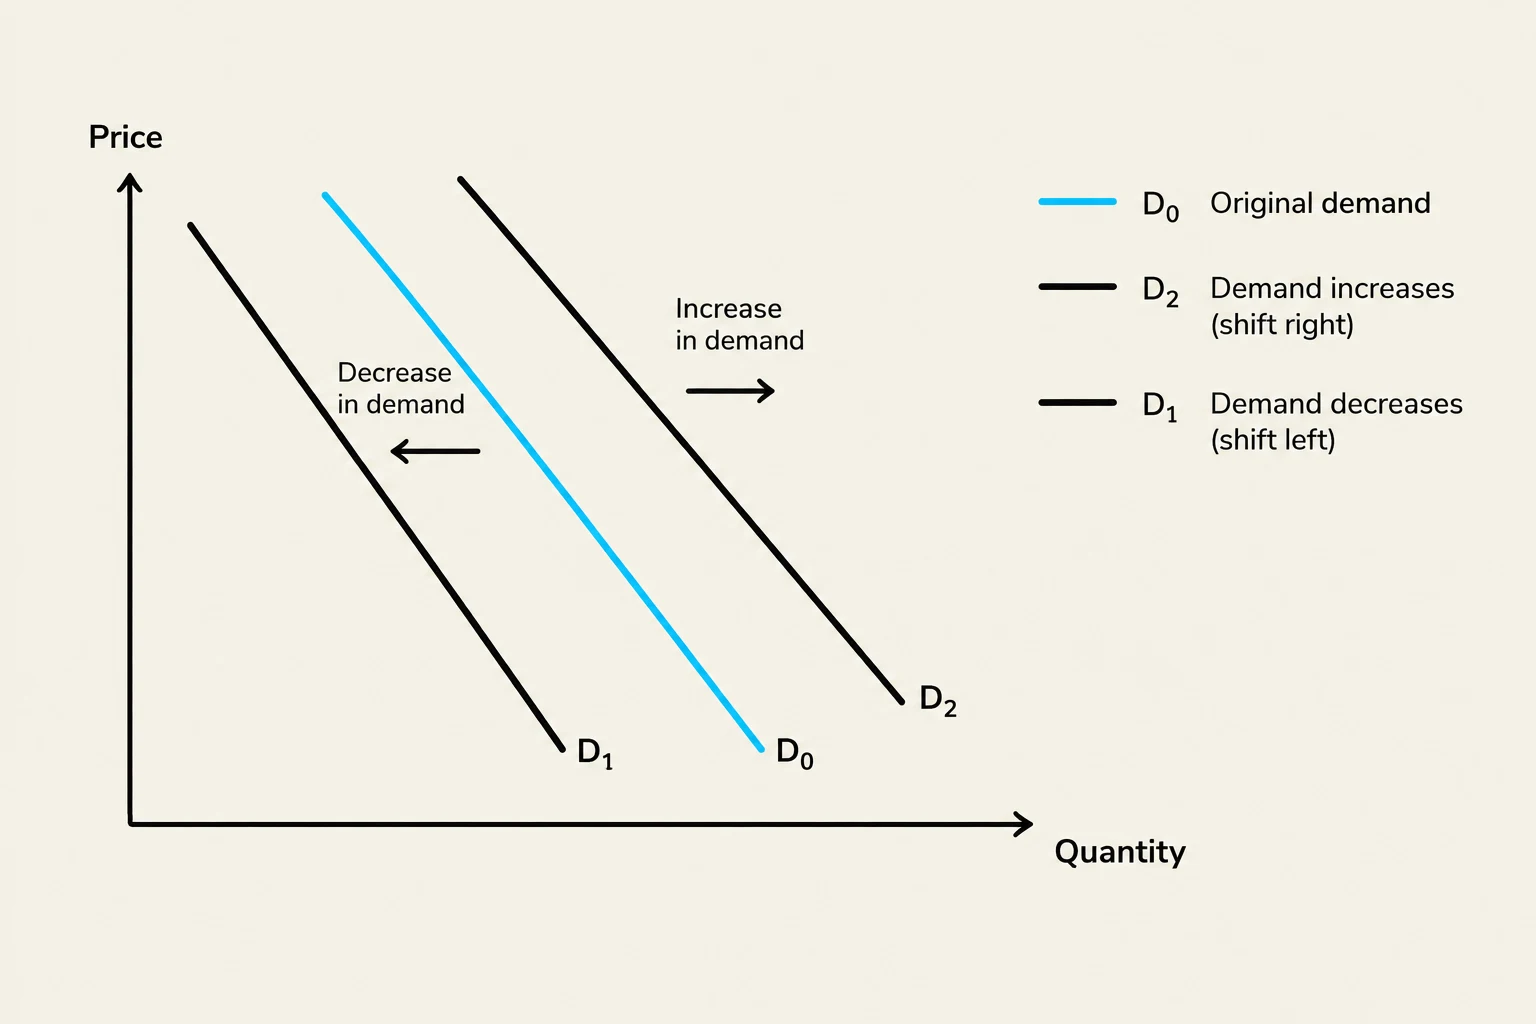
A shift of the entire demand curve occurs when any factor other than the good's own price changes.
An Increase in Demand (Right Shift): The entire curve moves to the right. This can be caused by an increase in income (for normal goods), an increase in the price of a substitute, or a decrease in the price of a complement.
A Decrease in Demand (Left Shift): The entire curve moves to the left. This can be caused by a decrease in income (for normal goods), a decrease in the price of a substitute, or an increase in the price of a complement.
This graph illustrates the concept of demand shifts in economics. The original demand curve is labeled D0. A decrease in demand is shown as a leftward shift to D1, and an increase in demand is depicted as a rightward shift to D2.
Keep reading for free.
Create an account to finish this reading and make it part of your study routine.