Financial Ratio Analysis and Accounting Fundamentals
This guide explains the fundamentals of accounting, including core financial statements like the balance sheet and income statement, and introduces various types of financial ratio analysis used to assess a company's performance and financial health.
To succeed in the business world, understanding accounting is not just an advantage—it is a necessity. Accounting is the systematic process of recording, classifying, summarizing, and interpreting financial transactions and events. While many people confuse bookkeeping with accounting, bookkeeping is merely the initial recording of data, whereas accounting involves the higher-level interpretation of that data to support decision-making for managers, investors, and government agencies.
One of the most powerful tools in an accountant's arsenal is ratio analysis. This process involves calculating and interpreting specific ratios derived from a firm's financial statements to evaluate its actual performance against historical data, current objectives, and industry competitors.
The Foundation: Core Financial Statements
Before performing ratio analysis, one must understand the primary documents from which these ratios are derived. These statements provide a snapshot of a company's financial health.
The Balance Sheet
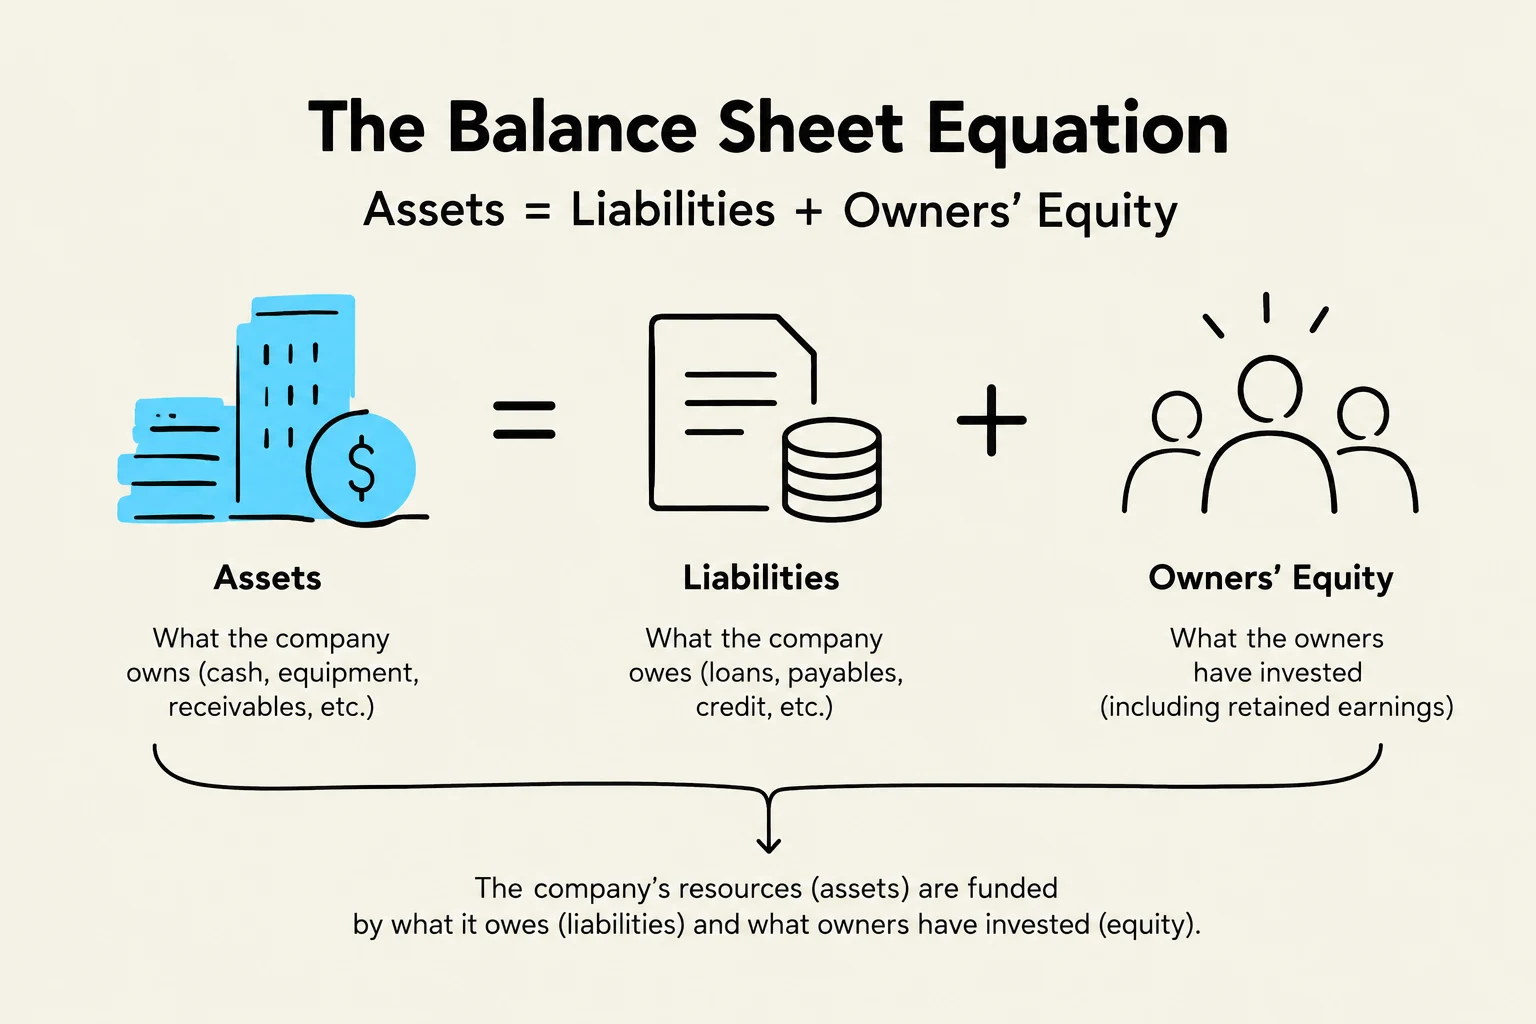
The balance sheet (also known as the Statement of Financial Position) reports a firm’s financial position on a specific date. It is built upon the fundamental accounting equation, which organizes items into three categories: Assets, Liabilities, and Owners' Equity.
Assets: Economic resources owned by a firm. These are listed according to their liquidity—how quickly they can be converted into cash. Assets include current assets (cash, receivables, inventory), capital/fixed assets (land, buildings), and intangible assets (patents, trademarks).
Liabilities: What the business owes to others. These include current liabilities (debts due within one year, like accounts payable) and long-term liabilities (debts due after one year, like bonds payable).
Owners' Equity: The residual interest in the assets after deducting liabilities. In a corporation, this is referred to as shareholders' equity.
The balance sheet equation illustrates that a company's assets are funded by its liabilities and owners' equity.
The Income Statement
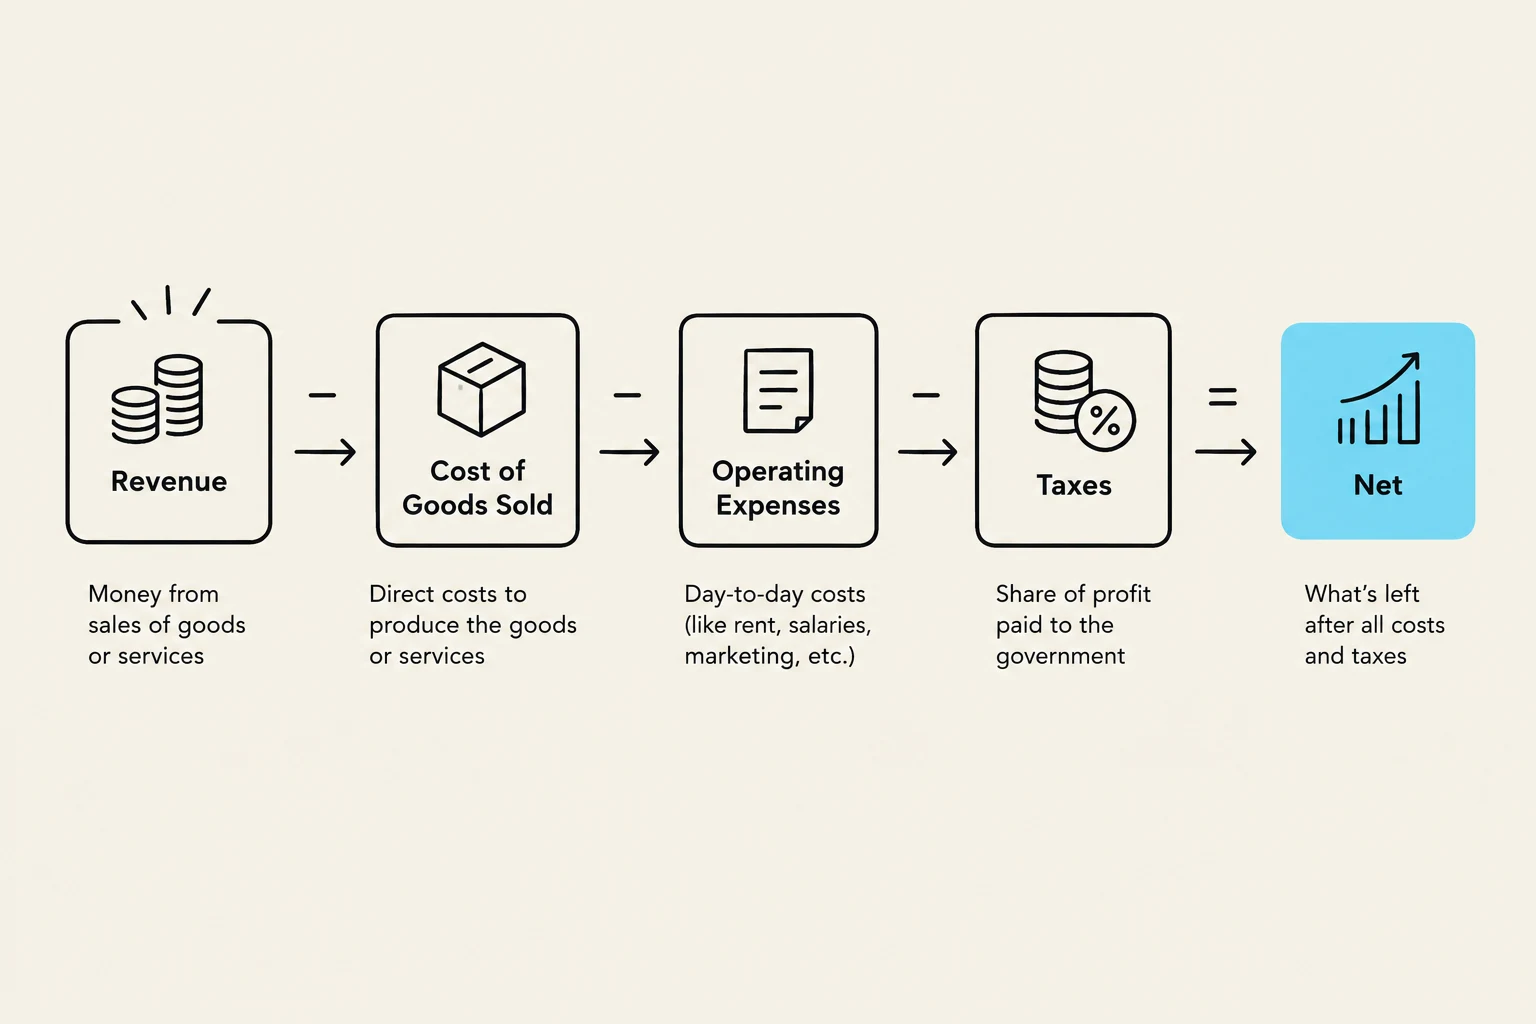
The income statement (or Statement of Revenues and Expenses) summarizes a firm's financial activity over a specific period of time. It highlights the "bottom line"—the net profit or loss after all costs, expenses, and taxes have been deducted.
Key components include:
Revenue: The value received for goods sold or services rendered.
Cost of Goods Sold (COGS): The cost of merchandise sold or raw materials used.
Gross Profit: Calculated as Net Sales minus COGS.
Operating Expenses: Costs required to run the business, such as rent, salaries, and amortization (the spreading of the cost of equipment over its useful life).
Categories of Ratio Analysis
Once the financial statements are prepared, analysts use ratios to transform raw numbers into meaningful insights.
1. Liquidity Ratios
Liquidity ratios measure a company's ability to convert assets into cash to satisfy its short-term debts (liabilities due within one year).
Current Ratio: Compares total current assets to total current liabilities.
Current Ratio=Current LiabilitiesCurrent Assets
Acid-Test (Quick) Ratio: A more stringent measure that excludes less liquid assets like inventory, focusing only on cash, marketable securities, and receivables.
Acid-Test Ratio=Current LiabilitiesCash+Marketable Securities+Receivables
2. Leverage (Debt) Ratios
These ratios assess the degree to which a firm relies on borrowed funds to finance its operations. While debt can fuel growth, excessive leverage increases financial risk and can lead to operational instability.
3. Profitability (Performance) Ratios
Profitability ratios evaluate how effectively management utilizes resources to generate profit.
Earnings Per Share (EPS): Indicates how much profit is allocated to each outstanding share of common stock.
Return on Sales: Measures how much profit is produced per dollar of sales.
Return on Equity (ROE): Measures the ability of a firm to generate profits from its shareholders' investments.
This diagram illustrates the basic components of calculating net profit, starting with revenue and subtracting the cost of goods sold, operating expenses, and taxes.
4. Activity Ratios
Activity ratios measure operational efficiency, specifically how well management handles its assets. A primary example is the inventory turnover ratio, which measures the speed at which inventory is converted into sales. High turnover is generally preferred because idle inventory incurs costs without generating revenue.
Exam Tip: When calculating ratios, always check if the question asks for a "quick" measure. If it does, use the Acid-Test ratio rather than the Current ratio to ensure you are excluding inventory.
The Broader Accounting Landscape
Accounting is not a monolith; it is a diverse profession divided into five major functional areas:
Financial Accounting: Focuses on generating information for external users, such as creditors, investors, and the general public.
Managerial Accounting: Focuses on providing internal reports to help managers pinpoint problems and opportunities within the organization.
Compliance (Auditing): Involves reviewing and evaluating records to provide an unbiased opinion on the accuracy of financial statements. This is a critical function for public corporations.
Tax Accounting: Focuses on preparing tax returns and developing strategies to ensure compliance with government regulations.
Governmental and Not-for-Profit Accounting: Tailors accounting systems to meet the needs of citizens, legislative bodies, and contributors who want to ensure funds are being used properly.
Inventory Valuation: FIFO vs. LIFO
In the process of recording costs, accountants must choose a method for valuing inventory. Two common methods are:
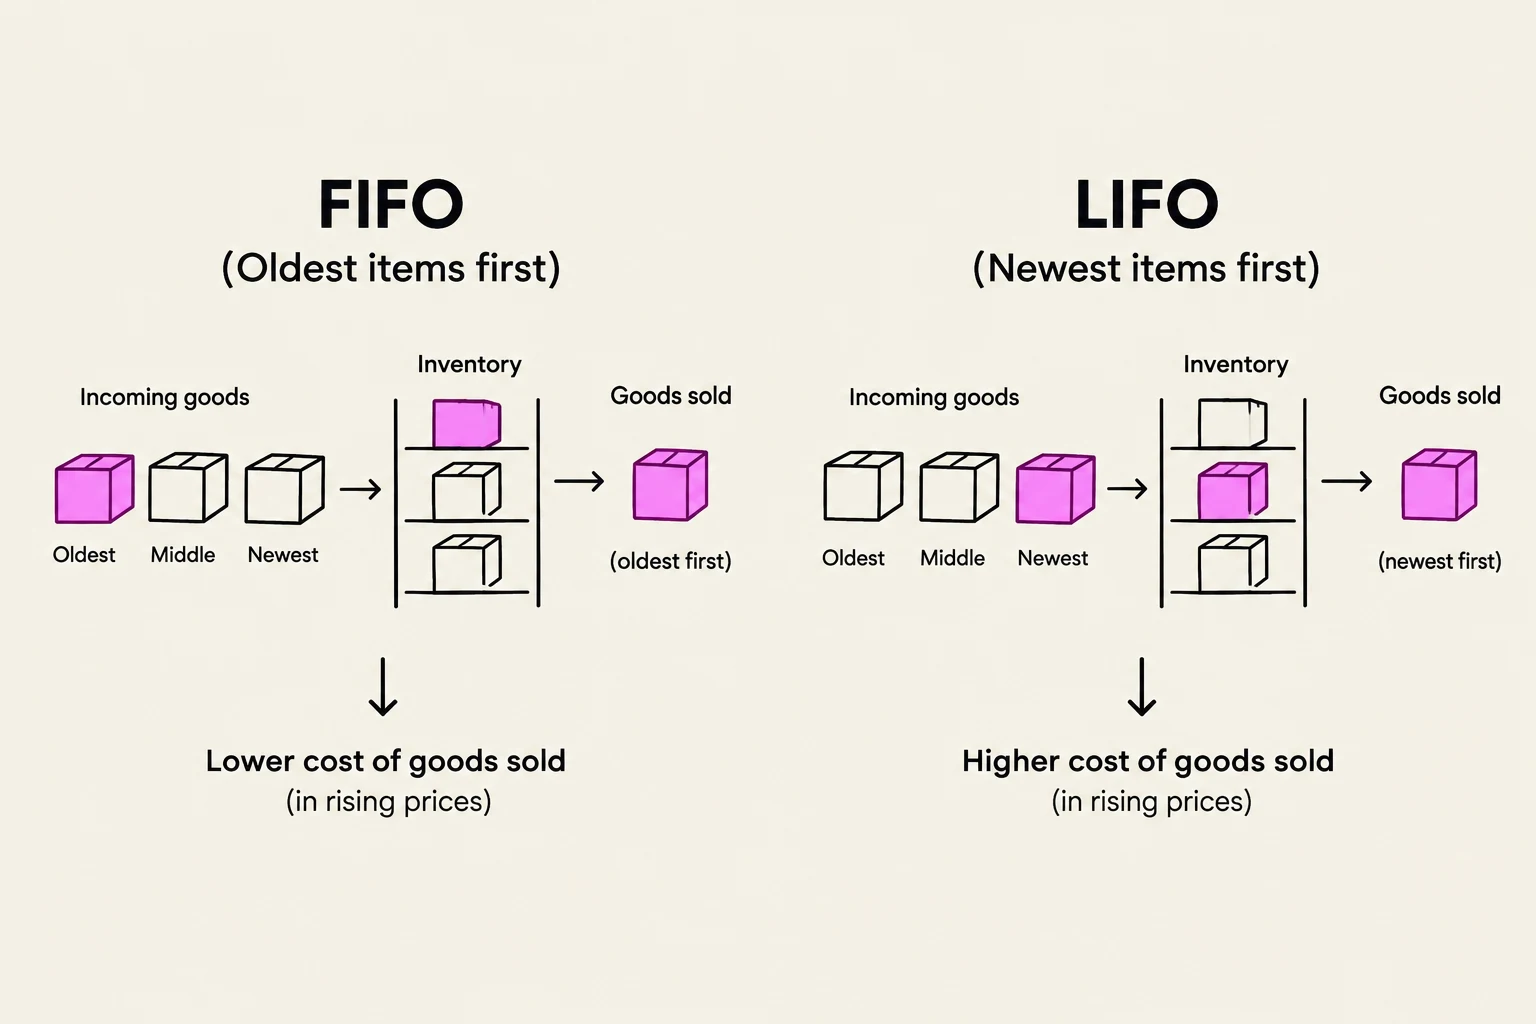
FIFO (First-In, First-Out): Assumes the oldest inventory items are sold first.
LIFO (Last-In, First-Out): Assumes the most recently acquired items are sold first.
This diagram illustrates the First-In, First-Out (FIFO) and Last-In, First-Out (LIFO) inventory accounting methods, showing how they affect the cost of goods sold, particularly in periods of rising prices.
By combining a deep understanding of accounting fundamentals with the analytical power of ratios, professionals can transform raw financial data into a strategic roadmap for business success.
Keep reading for free.
Create an account to finish this reading and make it part of your study routine.