Learn about constructing genetic maps using three-point testcrosses, determining gene order, and calculating recombination frequencies in eukaryotic organisms.
In genetics, understanding the physical location of genes on a chromosome is essential for determining how traits are inherited. While simple two-point crosses can provide basic information about linkage, they often fail to provide a complete picture of the relative positions of multiple genes. To construct a more accurate genetic map, scientists utilize the three-point testcross, a method that allows for the determination of gene order and the calculation of precise map distances between three different loci.
The Three-Point Testcross
A three-point testcross involves crossing a triple heterozygote with a homozygous recessive individual. Because there are three loci involved, the offspring can exhibit 23=8 different possible phenotypes. By analyzing the frequency of these eight phenotypes, researchers can deduce the arrangement of genes on the chromosome.
Determining Gene Order
The most critical step in a three-point cross is determining the correct order of the genes. To do this, you must categorize the progeny into two specific groups:
Nonrecombinant progeny: These are the two most numerous phenotypes in the offspring. They represent the parental combinations of alleles.
Double-crossover (DX) progeny: These are the two least numerous phenotypes. They result from two simultaneous crossover events.
To find the middle gene, compare the phenotypes of the double-crossover progeny to the nonrecombinant progeny. The double-crossover offspring will look almost identical to the nonrecombinants, except for one single characteristic. The gene that "switches" its relationship relative to the others in the double-crossover class is the gene located in the middle.
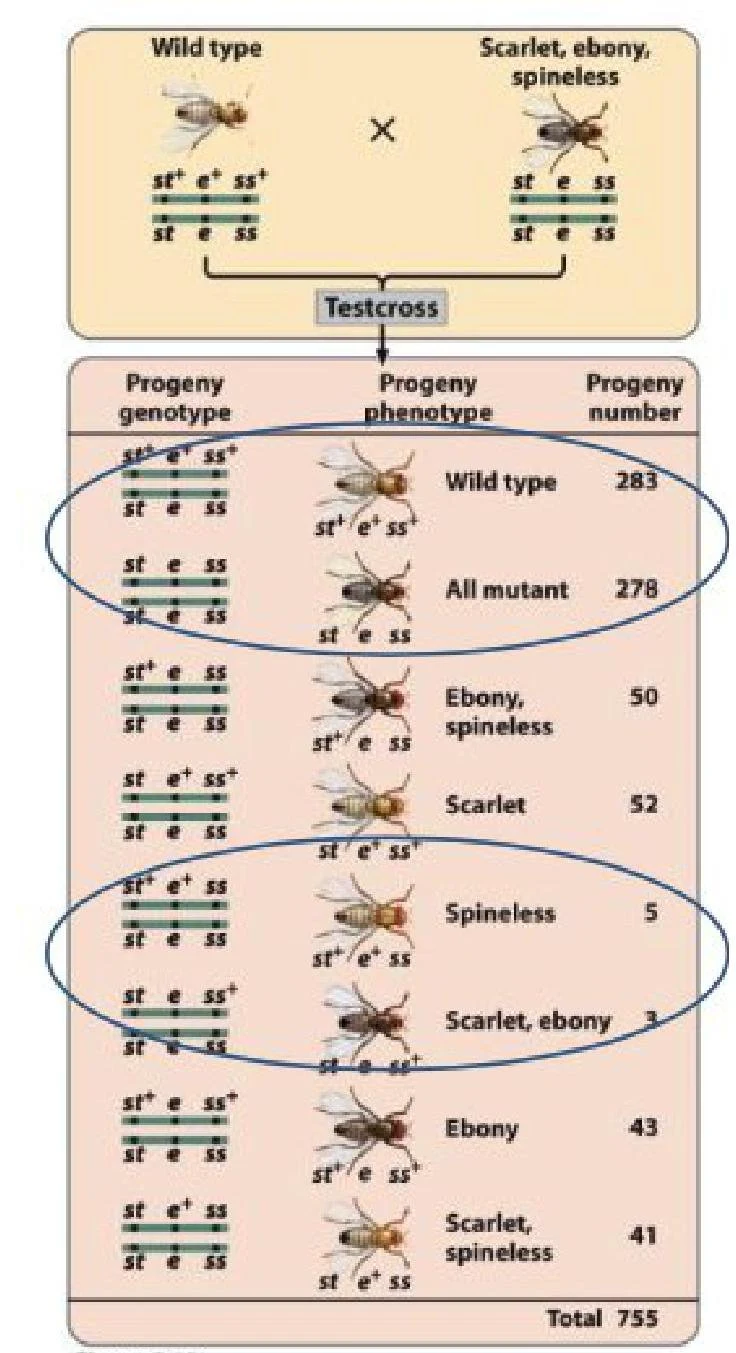
This diagram illustrates a genetic testcross experiment involving fruit flies, showing the inheritance patterns of different traits such as wild type, scarlet, ebony, and spineless phenotypes, along with their corresponding genotypes and progeny numbers.Figure 7.13: Illustrating gene mapping and recombinant frequencies.
Diagram illustrating single and double crossover events during meiosis, showing how genetic recombination can alter gene combinations on chromosomes.Figure 7.12: Single and double crossover events.
Calculating Recombination Frequencies and Map Distances
Once the gene order is established, the next step is to calculate the distance between adjacent genes. The distance between two genes is expressed as a recombination frequency, which represents the percentage of recombinant offspring.
To calculate the distance between two adjacent genes (for example, gene s and gene st), you must sum the number of single crossovers occurring between them and the double crossovers, then divide by the total number of progeny:
Example Calculation
If a cross results in 755 total progeny, and the sum of single crossovers between two genes and the double crossovers is 110 (50+52+5+3), the calculation would be:
755110×100=14.57%
This value (14.6%) represents the map distance in centimorgans (cM).
Note that if you know the distance between the two outer genes, you can find the middle distance by subtraction, as the total distance is the sum of the two smaller intervals.
Interference and the Coefficient of Coincidence
In an ideal mathematical model, the probability of a double crossover should be the product of the probabilities of the two individual single crossovers. However, in biological systems, crossovers are often not independent events.
Interference
Often, the occurrence of one crossover event physically inhibits the formation of another crossover nearby. This phenomenon is known as interference. To quantify this, we use two metrics:
Coefficient of Coincidence (C): This is the ratio of the observed number of double crossovers to the expected number of double crossovers.
C=Expected DXObserved DX
Interference (I): This is calculated as:
I=1−C
If the interference is 0.4, it means that 40% of the expected double-crossover progeny were not observed due to the inhibitory effect of the first crossover.
Biological Insight: Crossovers are thought to reduce torsional stress on the DNA. Topoisomerase enzymes play a crucial role here by relieving the torsional stress caused by the unwinding of the DNA during recombination, which contributes to the mechanism of crossover interference.
While interference is common, negative interference can occasionally be observed, where a crossover actually increases the likelihood of another crossover occurring nearby.
Multiple Crossovers and Mapping Functions
It is important to remember that recombination is not limited to just two strands. Multiple crossovers (three-strand or four-strand) can occur. Because these multiple crossovers can "undo" the visible recombinant phenotype, they often go undetected. This leads to an underestimation of the true physical distance between genes; the further apart two genes are, the more inaccurate the map distance becomes.
This diagram illustrates the concept of double crossovers in genetics, showing how different types of crossovers (two-strand, three-strand, and four-strand) result in varying percentages of detectable recombinant offspring.Figure: Comparing different types of multiple crossovers.
To correct for these discrepancies, geneticists use mapping functions. These are mathematical formulas designed to relate the observed recombination frequencies to the actual physical distances between genes on a chromosome.
Modern Applications: Genome-Wide Association Studies (GWAS)
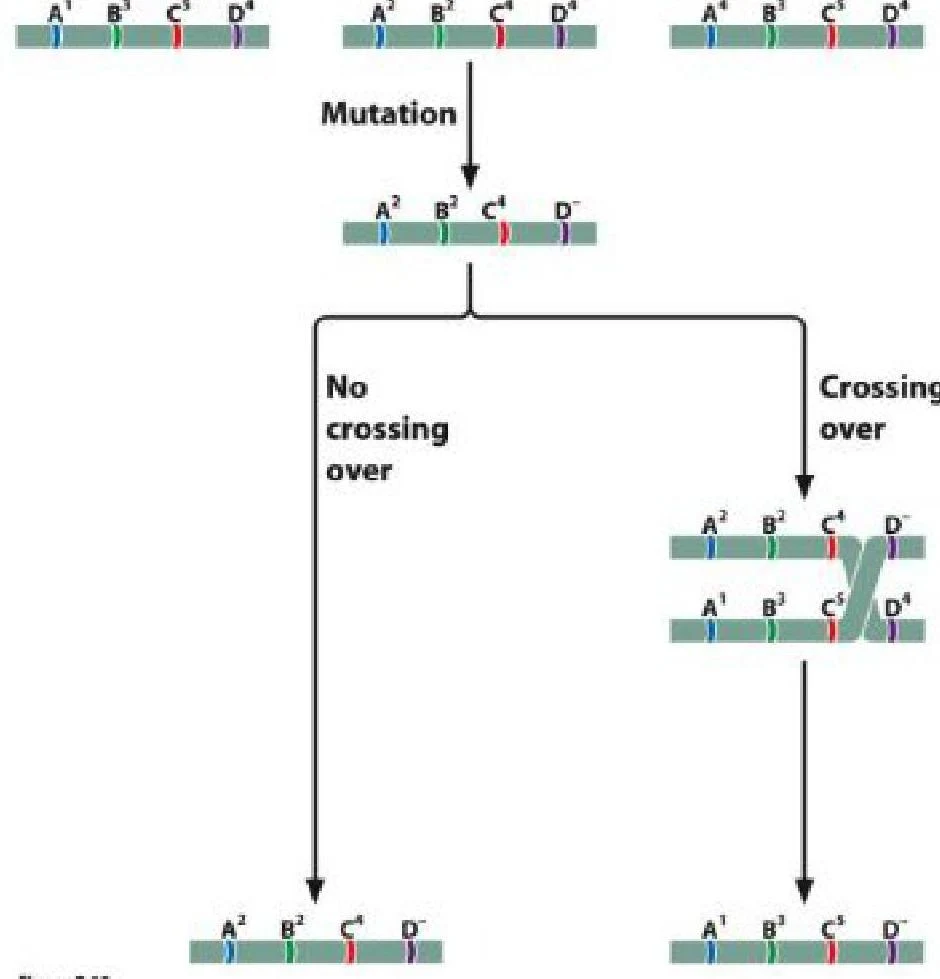
The principles of linkage mapping have evolved into sophisticated modern techniques like Genome-Wide Association Studies (GWAS). Instead of looking at controlled crosses, GWAS examines associations between specific traits and alleles within a population by observing haplotypes (sets of linked genes).
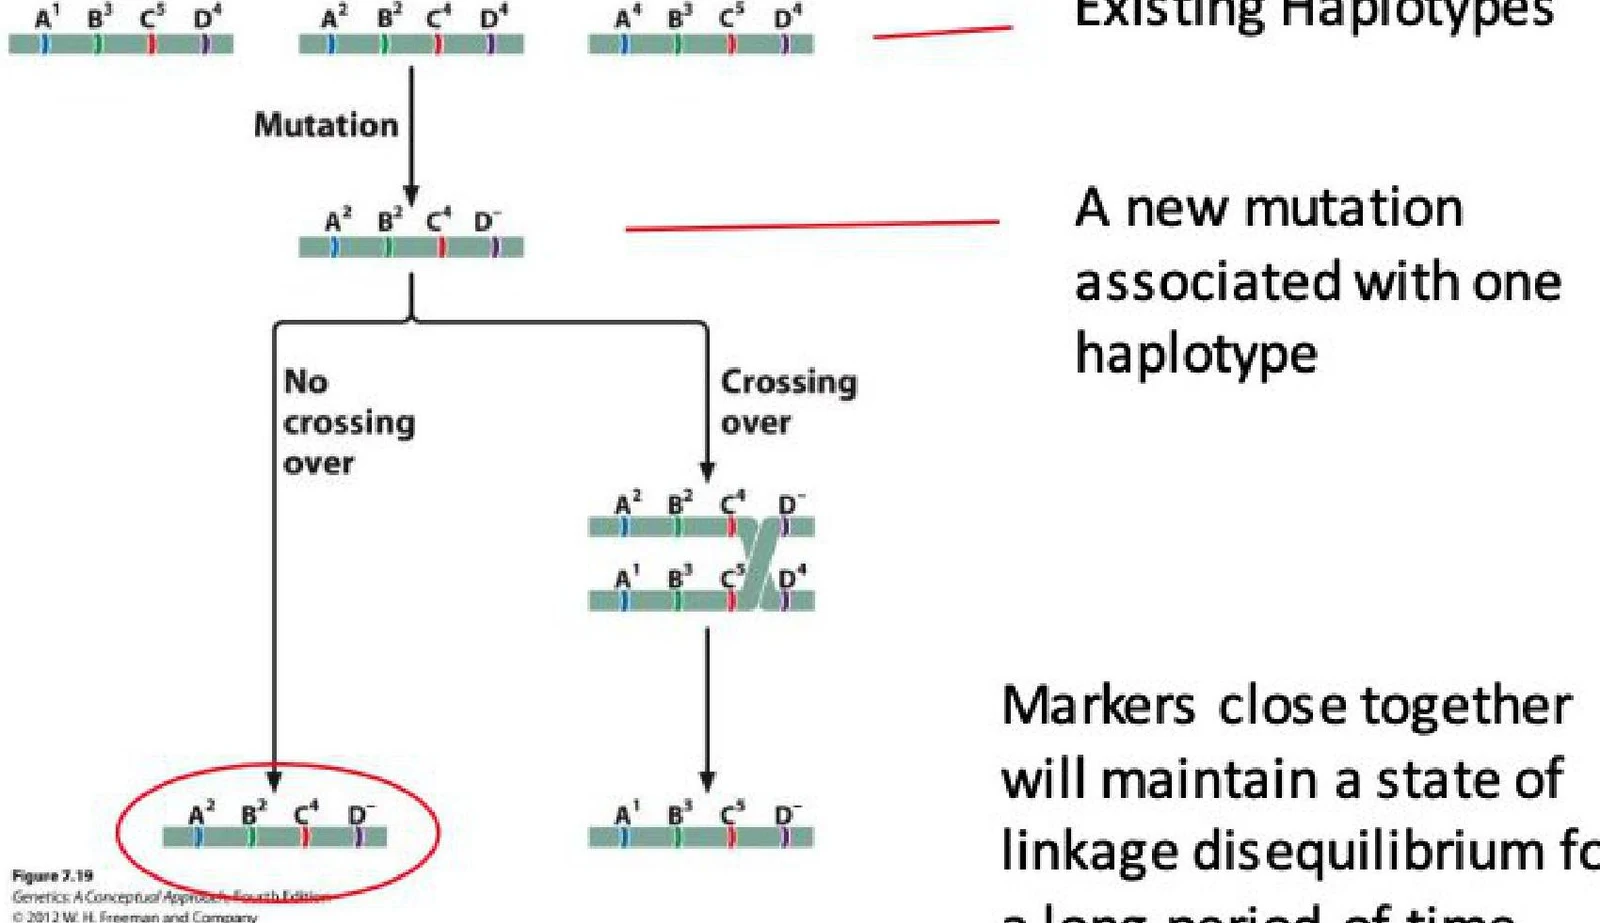
This method relies on linkage disequilibrium, which is the nonrandom association of alleles at different loci. Because genes that are physically close to each other on a chromosome are less likely to be separated by a crossover event, they tend to be inherited together as a block. Therefore, if a specific trait is strongly associated with a particular genetic marker, it indicates that the gene responsible for that trait is located very close to that marker on the chromosome.
Diagram illustrating gene mutation and crossing over during meiosis.Figure 7.19: Mutation and crossing over in haplotype inheritance.
This diagram illustrates the process of mutation and crossing over in genetics, showing how these events can lead to changes in haplotypes and affect linkage disequilibrium.Figure: Haplotype inheritance and linkage disequilibrium.
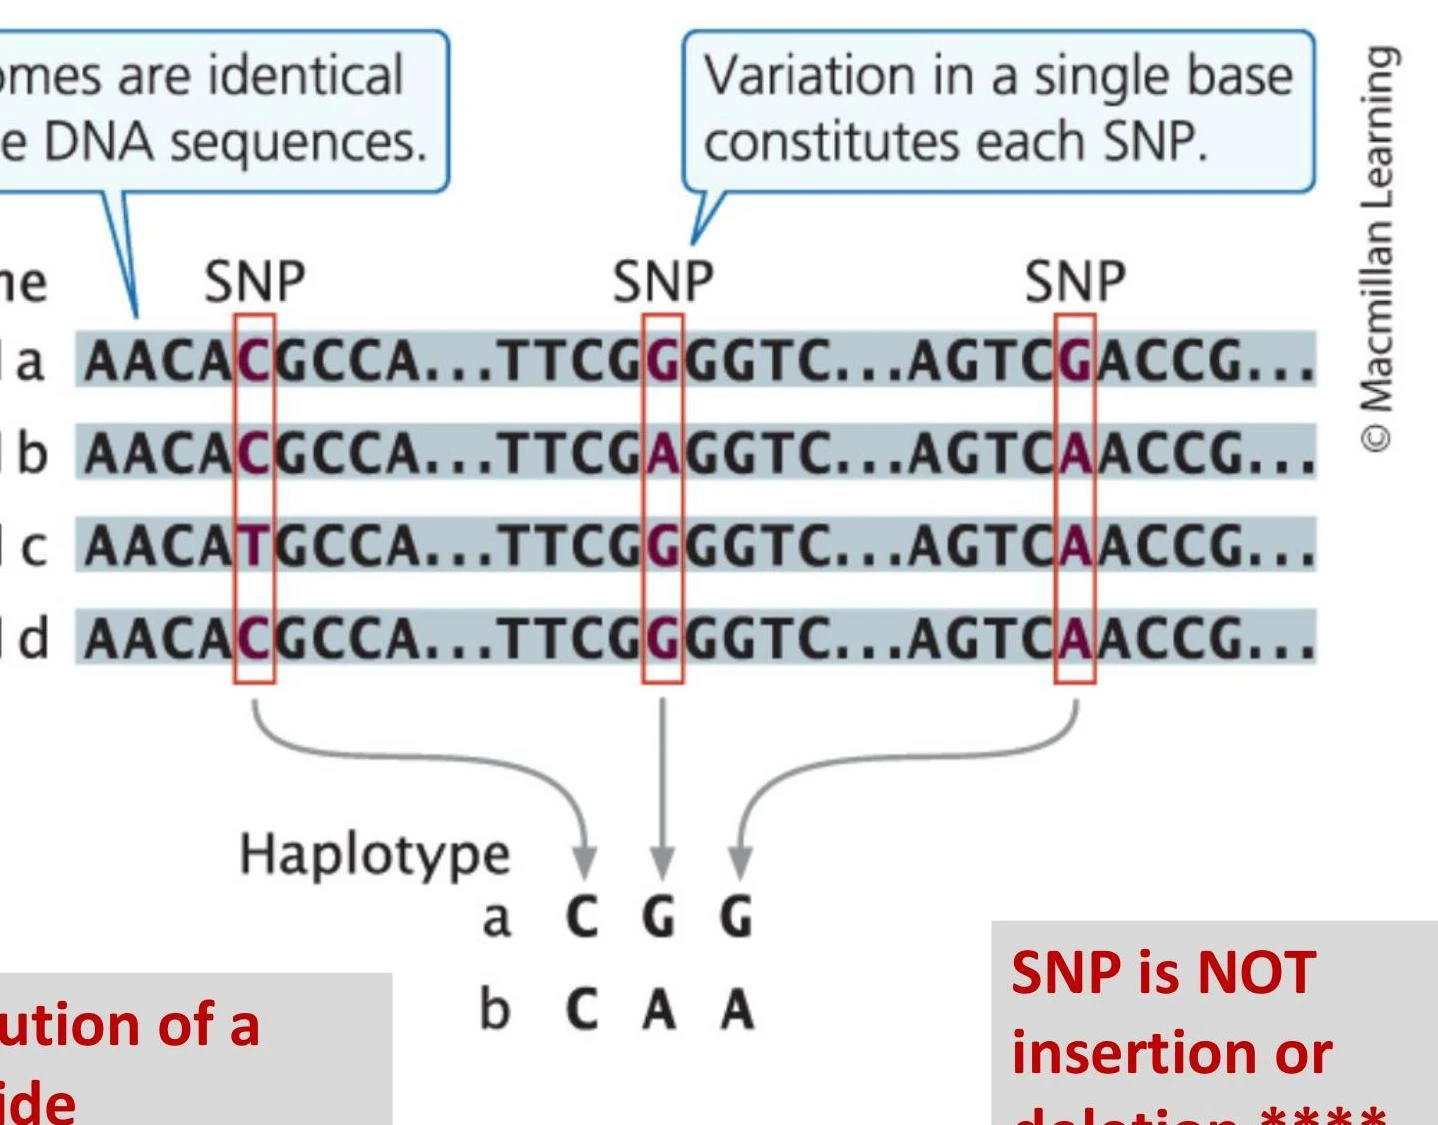
A haplotype is defined as a specific set of Single Nucleotide Polymorphisms (SNPs) and other genetic variants observed on a single chromosome or part of a chromosome. By mapping these variations, scientists can pinpoint the genomic regions associated with complex diseases and traits.
This illustration shows how single nucleotide polymorphisms (SNPs) represent variations in DNA sequences. Different haplotypes are formed based on these variations.Figure: Visualizing SNPs and resulting haplotypes.
Keep reading for free.
Create an account to finish this reading and make it part of your study routine.