Electrocardiography Principles and the 12-Lead ECG
This guide explains the fundamental principles of electrocardiography (ECG), including the function of the 12-lead ECG, standard waveforms (P wave, PR interval, QRS complex, T wave), and the meaning of wave deflections. It also differentiates between continuous monitoring and a 12-lead ECG and discusses managing artifa
Electrocardiography (ECG) is a fundamental diagnostic tool used to record the electrical activity of the heart from the body's surface. It is crucial to understand that an ECG measures electrical impulses, not the mechanical pumping of the heart; therefore, a rhythm appearing normal on a screen does not always guarantee that the patient is being adequately perfused.
Understanding the 12-Lead ECG
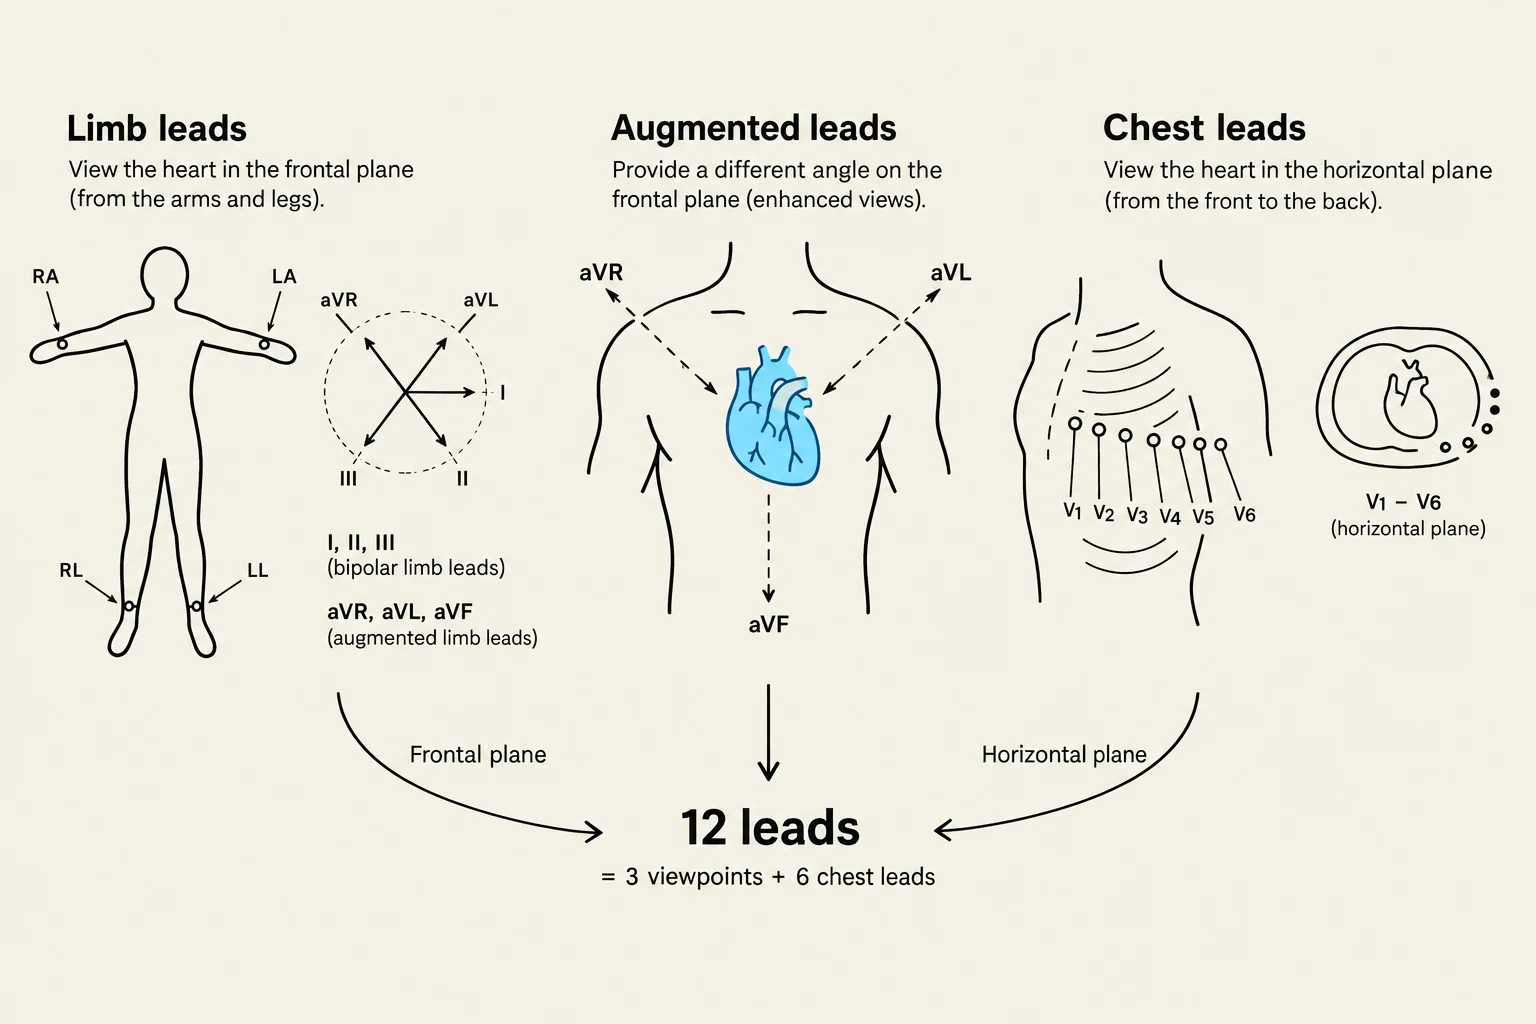
A common misconception is that a "lead" refers to the physical wires attached to a patient. In clinical practice, a lead is actually a viewpoint. While we typically use ten electrodes placed on the skin, these electrodes work together to provide twelve different perspectives of the same electrical event.
The 12-lead ECG is organized into specific groups to provide a comprehensive map of the heart's electrical activity:
Limb Leads: These view the heart in the frontal plane (looking from the left, right, and inferior perspectives).
Augmented Leads (aVR, aVL, aVF): These also view the frontal plane but use electronic amplification to boost the signal amplitude.
Precentral (Chest) Leads (V1–V6): These provide a view of the horizontal plane, looking at the heart from front-to-back.
The clinical value of having twelve different views is immense: a pathological change, such as an injury or an ectopic beat, might be hidden in one lead but clearly visible in another.
Diagram illustrating the placement of limb and chest leads for an electrocardiogram (ECG), showing how they view the heart from different planes.
The Standard ECG Waveform
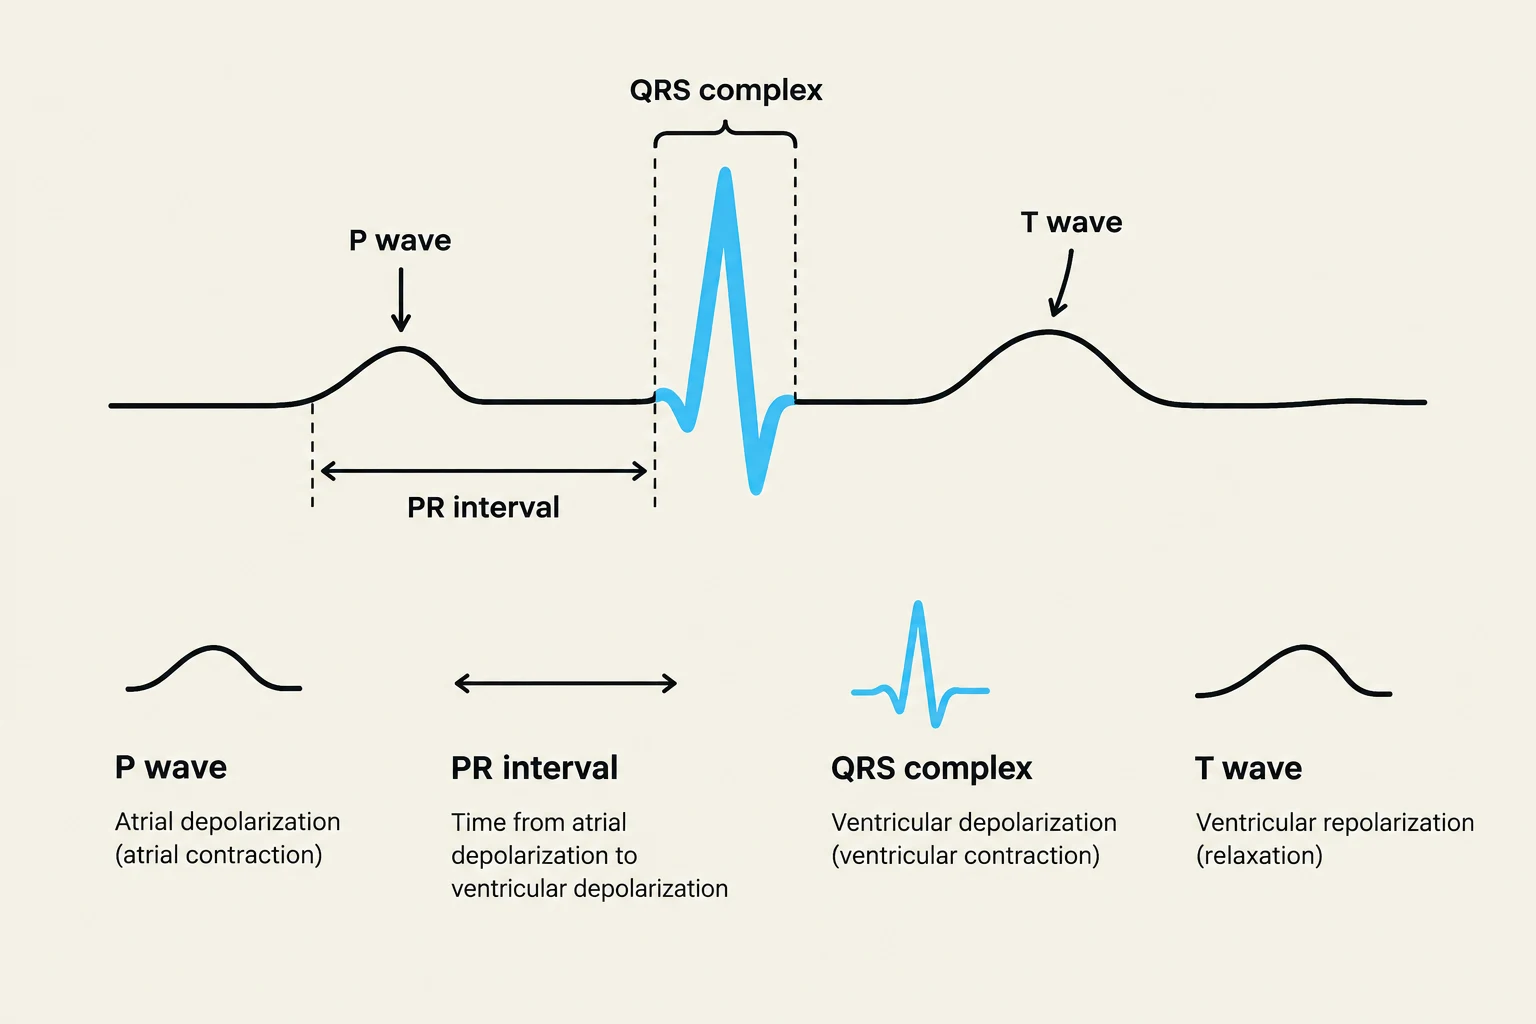
Every heartbeat produces a specific sequence of waves that correspond to the physiological conduction of electricity through the heart muscle.
P Wave: Represents atrial depolarization, which is the electrical trigger for the atria to contract.
PR Interval: This measures the time it takes for the electrical impulse to travel from the atria through the AV node. A prolonged PR interval (greater than 0.20 seconds) is a clinical indicator of a conduction delay.
QRS Complex: Represents ventricular depolarization, the massive electrical surge that triggers the main pumping chambers of the heart.
T Wave: Represents ventricular repolarization, the period when the ventricles electrically reset for the next beat.
Diagram illustrating the components of an electrocardiogram (ECG) including the P wave, PR interval, QRS complex, and T wave, with explanations of what each represents in terms of cardiac electrical activity.
Deflection: Direction and Meaning
The direction in which a wave moves on the ECG paper—whether it goes up or down—is determined by the direction of the electrical current relative to the positive electrode of the lead.
Positive Deflection (Upward): Occurs when the electrical current flows toward the positive electrode.
Negative Deflection (Downward): Occurs when the electrical current flows away from the positive electrode.
Biphasic: Occurs when the current flows partly toward and partly away from the electrode, resulting in both upward and downward movements.
Clinical Tip: A normal P wave should be upright (positive deflection) in Lead II because the impulse travels from the SA node toward that lead's positive electrode. If you see inverted or oddly shaped P waves, it may suggest the impulse is originating from an abnormal location (ectopic foci).
Continuous Monitoring vs. 12-Lead ECG
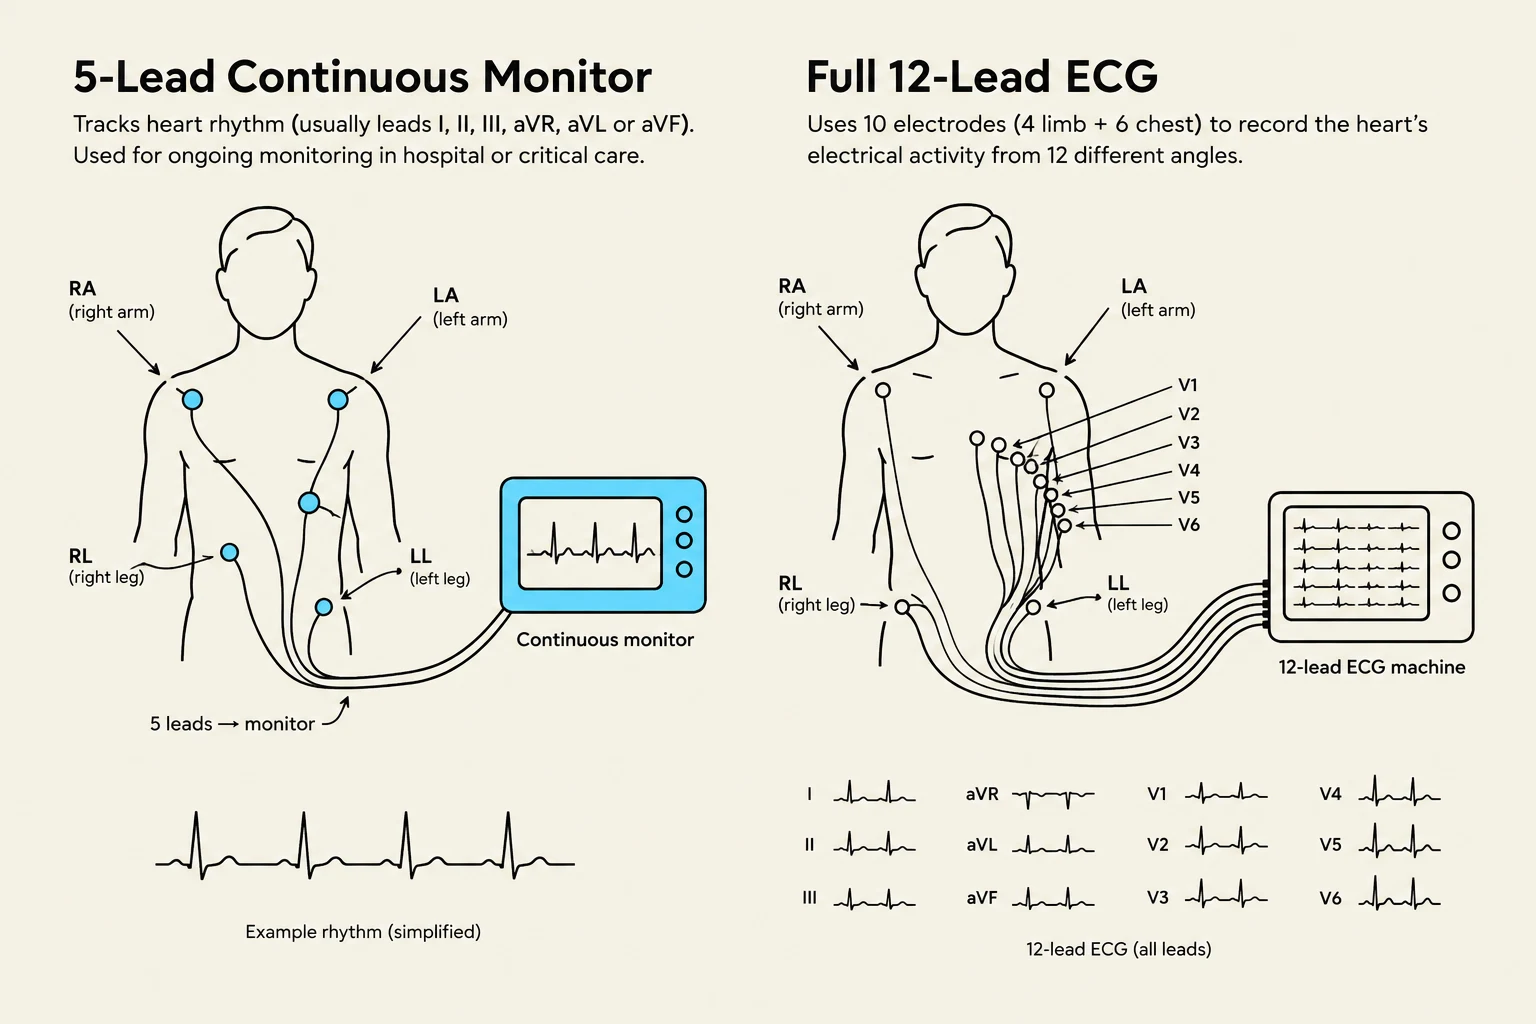
In a hospital setting, patients often have two types of ECG assessments. It is vital to know when to use each.
Feature
Continuous Monitoring (Bedside)
12-Lead ECG
Primary Purpose
To watch rate and rhythm over time
To diagnose specific cardiac issues
Number of Leads
Usually 3 to 5 leads
12 distinct viewpoints
Best Used For
Detecting sudden changes or alarms
Detailed diagnostic assessment
Limitation
Provides limited views of the heart
Not for continuous real-time watching
Diagrams illustrating the placement of electrodes for a 5-lead continuous heart monitor and a full 12-lead ECG, along with examples of ECG readings.
Managing Artifact and Alarms
Continuous monitors are prone to artifact—distortions in the tracing caused by patient movement, loose electrodes, or electrical interference. Before reacting to an alarm, always verify the electrodes and check the "gain" (the scale of the tracing) to ensure you are looking at a true rhythm rather than a disconnected lead.
The Golden Rule: Trust the Patient, Not the Monitor
The most dangerous pitfall in electrocardiography is relying solely on the electronic display. A monitor may show an organized rhythm, but the patient may be in a state of profound instability.
Pulsation VT (Ventricular Tachycardia) and VF (Ventricular Fibrillation): These are life-threatening, disorganized, or rapid rhythms that are generally "shockable" and require immediate intervention.
The "Ultimate Trap": Always check for a pulse. If the monitor shows a rhythm but the patient has no pulse, they are in cardiac arrest.
Summary Checklist for Deterioration:
Assess the patient: Check perfusion, chest pain, and breathing.
Verify the rhythm: Confirm the monitor rate against the actual palpable pulse.
Act: If the patient is unstable, call the rapid response/code team, ensure IV access, and prepare emergency equipment like a defibrillator.
Keep reading for free.
Create an account to finish this reading and make it part of your study routine.