


To understand how the human mind works, scientists must look at the biological engine driving it: the brain. Understanding brain function requires a multi-faceted approach because the brain operates on two distinct levels of communication. Within a single neuron, information travels via electrical impulses, while communication between different neurons is achieved through chemical signals known as neurotransmitters. Because of this dual nature, researchers utilize a variety of specialized methods—ranging from recording electrical rhythms to chemically manipulating brain sites—to map the relationship between neural activity and human behavior.
Electrical Recording: Capturing the Brain's Rhythm
One of the most common ways to study the brain's real-time activity is through electrical recording. Since neurons communicate internally via electrical impulses, we can measure these signals from the surface of the scalp.
Electroencephalogram (EEG)
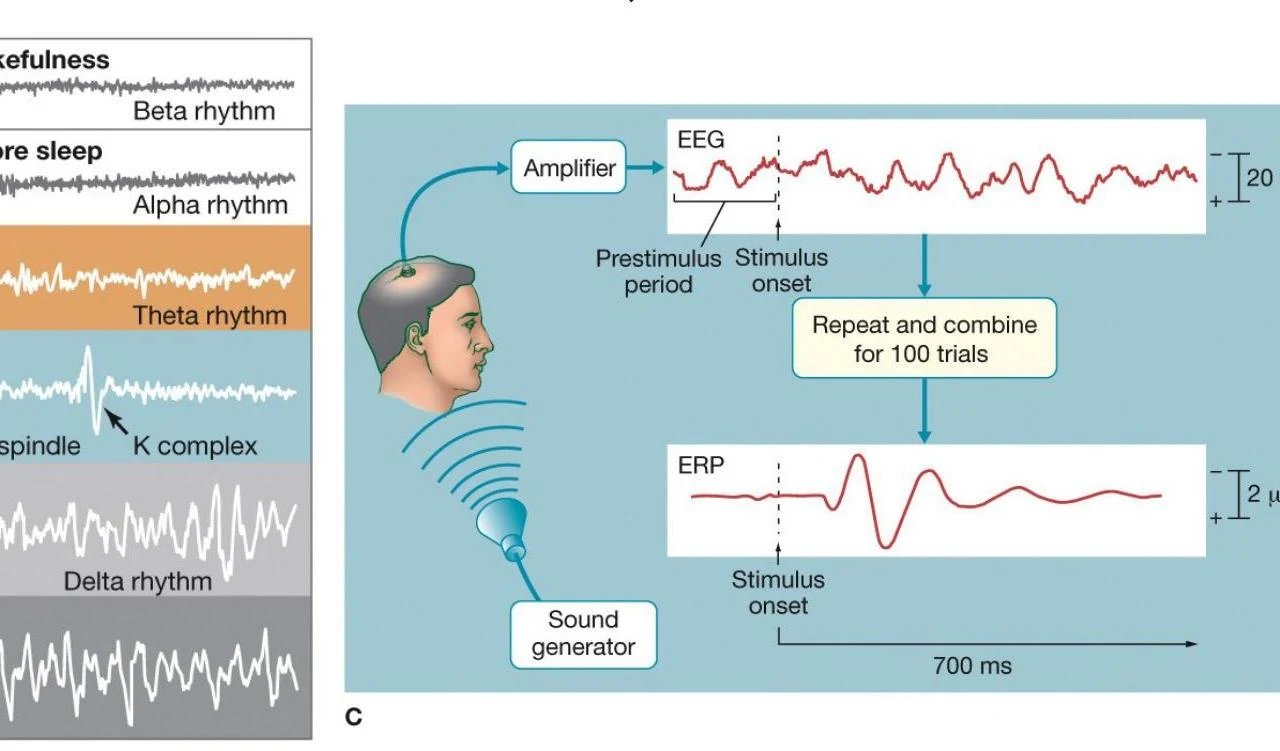
The Electroencephalogram (EEG) is a non-invasive method that uses a cap fitted with various electrodes to record electrical activity. This method is highly valued for its ability to track the "when" of brain activity, providing excellent temporal resolution.
Researchers primarily use EEG to study two types of patterns:
- Broad Brain Rhythms: These are large-scale patterns of activity, such as the different stages of sleep.
- Event-Related Potentials (ERPs): These are specific changes in electrical activity that occur in direct response to a particular input or stimulus, such as a sudden sound or a flash of light.
Keep reading for free.
Create an account to finish this reading and make it part of your study routine.
Continue reading freeAlready have an account? Log in
Updated