EKG Waveform Interpretation and Diagnosis of Pleuritis
This article explains the pathophysiology of EKG waveforms (P wave, QRS complex, T wave) and their correlation with cardiac electrical activity. It also details the diagnostic markers for pleuritis, including fever, leukocytosis, and the friction rub, and presents a clinical scenario for diagnosis.
In the clinical setting, the ability to rapidly interpret an electrocardiogram (EKG) and correlate physical examination findings with systemic inflammatory processes is a cornerstone of advanced practice. Understanding the electrical conduction system of the heart allows clinicians to identify rhythm disturbances, while recognizing specific physical signs—such as a friction rub—is essential for diagnosing acute inflammatory conditions like pleuritis. This article explores the pathophysiology of the EKG waveform and the diagnostic markers of pleuritic inflammation.
The Electrical Cycle: Decoding the EKG Waveform
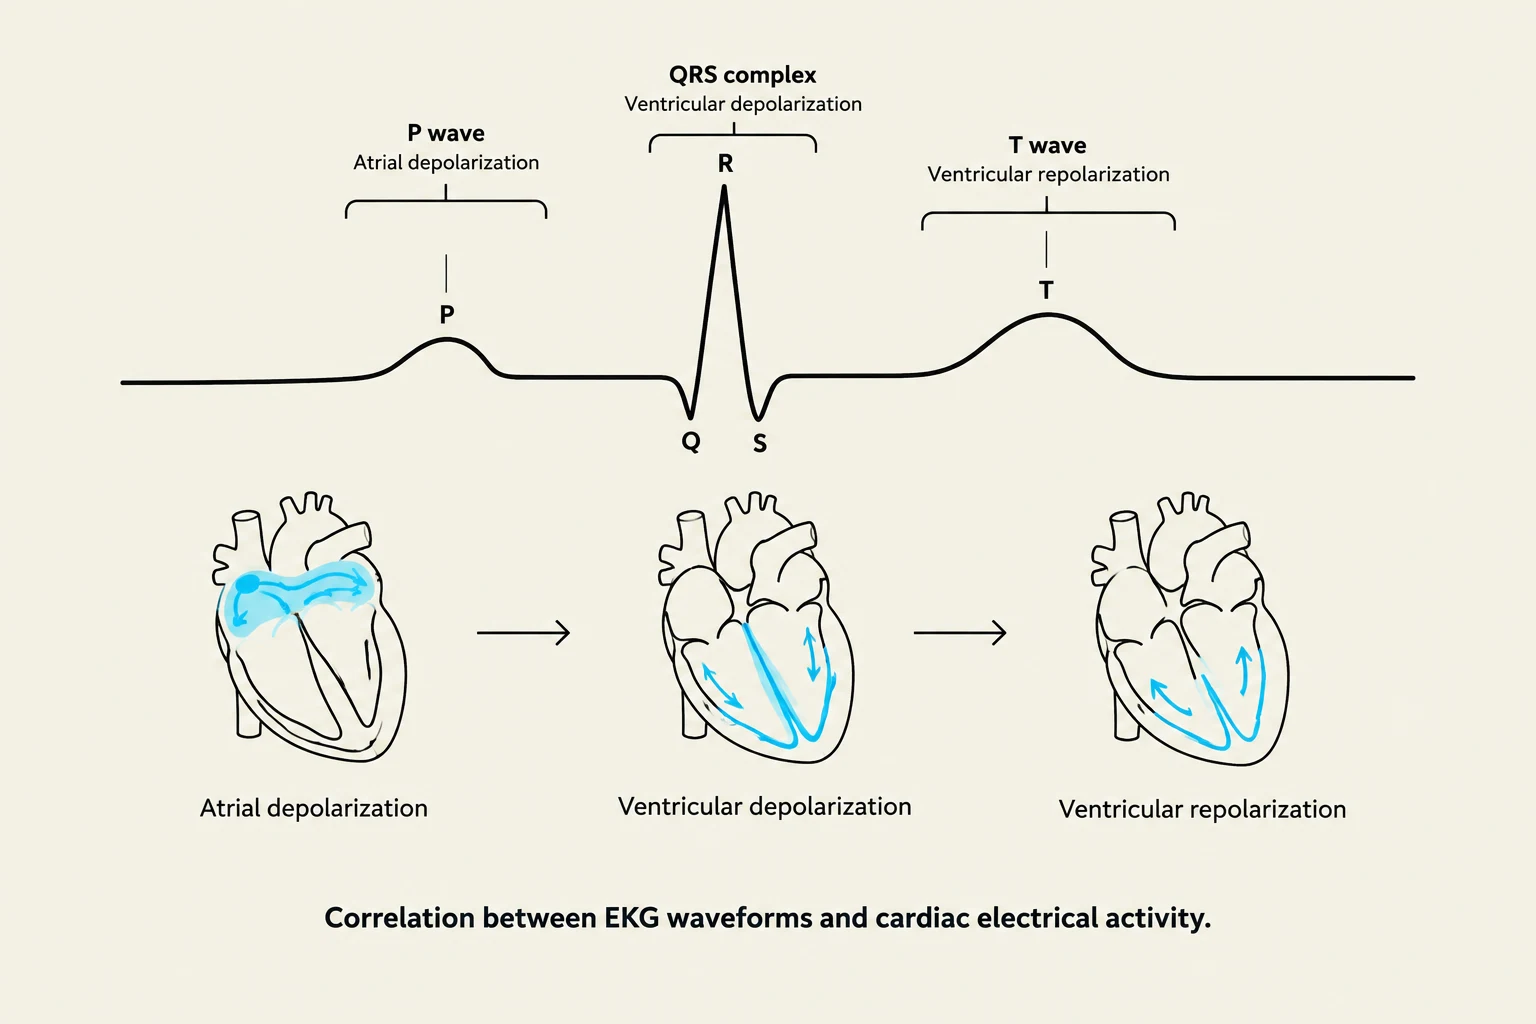
Correlation between EKG waveforms and cardiac electrical activity.
An electrocardiogram is a visual representation of the electrical activity occurring within the myocardium during each cardiac cycle. This activity is categorized into two primary phases: depolarization (electrical activation) and repolarization (electrical recovery).
Atrial Activity: The P Wave
The cardiac cycle begins with the electrical activation of the atria. The P wave is the specific component on an EKG that represents atrial depolarization. This electrical impulse triggers the mechanical contraction of the atria, pushing blood into the ventricles.
It is a common clinical pitfall to confuse atrial depolarization with atrial repolarization. While repolarization does occur, it is often "masked" or hidden on the EKG trace because it happens at the same time as the much larger electrical activity in the ventricles.
Ventricular Activity: The QRS Complex and T Wave
Once the impulse passes through the atrioventricular (AV) node, it enters the ventricles, initiating a much more powerful electrical event.
Ventricular Depolarization: This is represented by the QRS complex. Because the ventricular muscle mass is significantly larger than the atrial muscle mass, the QRS complex is much larger in amplitude than the P wave.
Ventricular Repolarization: Following depolarization, the ventricular cells must undergo an electrical recovery phase to prepare for the next impulse. This recovery is represented by the T wave.
Exam Tip: Distinguishing Waveforms
When reviewing EKG questions, remember the sequence:
Moving from the electrical activity of the heart to the physical examination of the thoracic cavity, clinicians must be able to differentiate between cardiac and pulmonary pathologies. A common diagnostic challenge involves patients presenting with acute chest pain accompanied by systemic signs of infection or inflammation.
Pathophysiology of Pleuritis
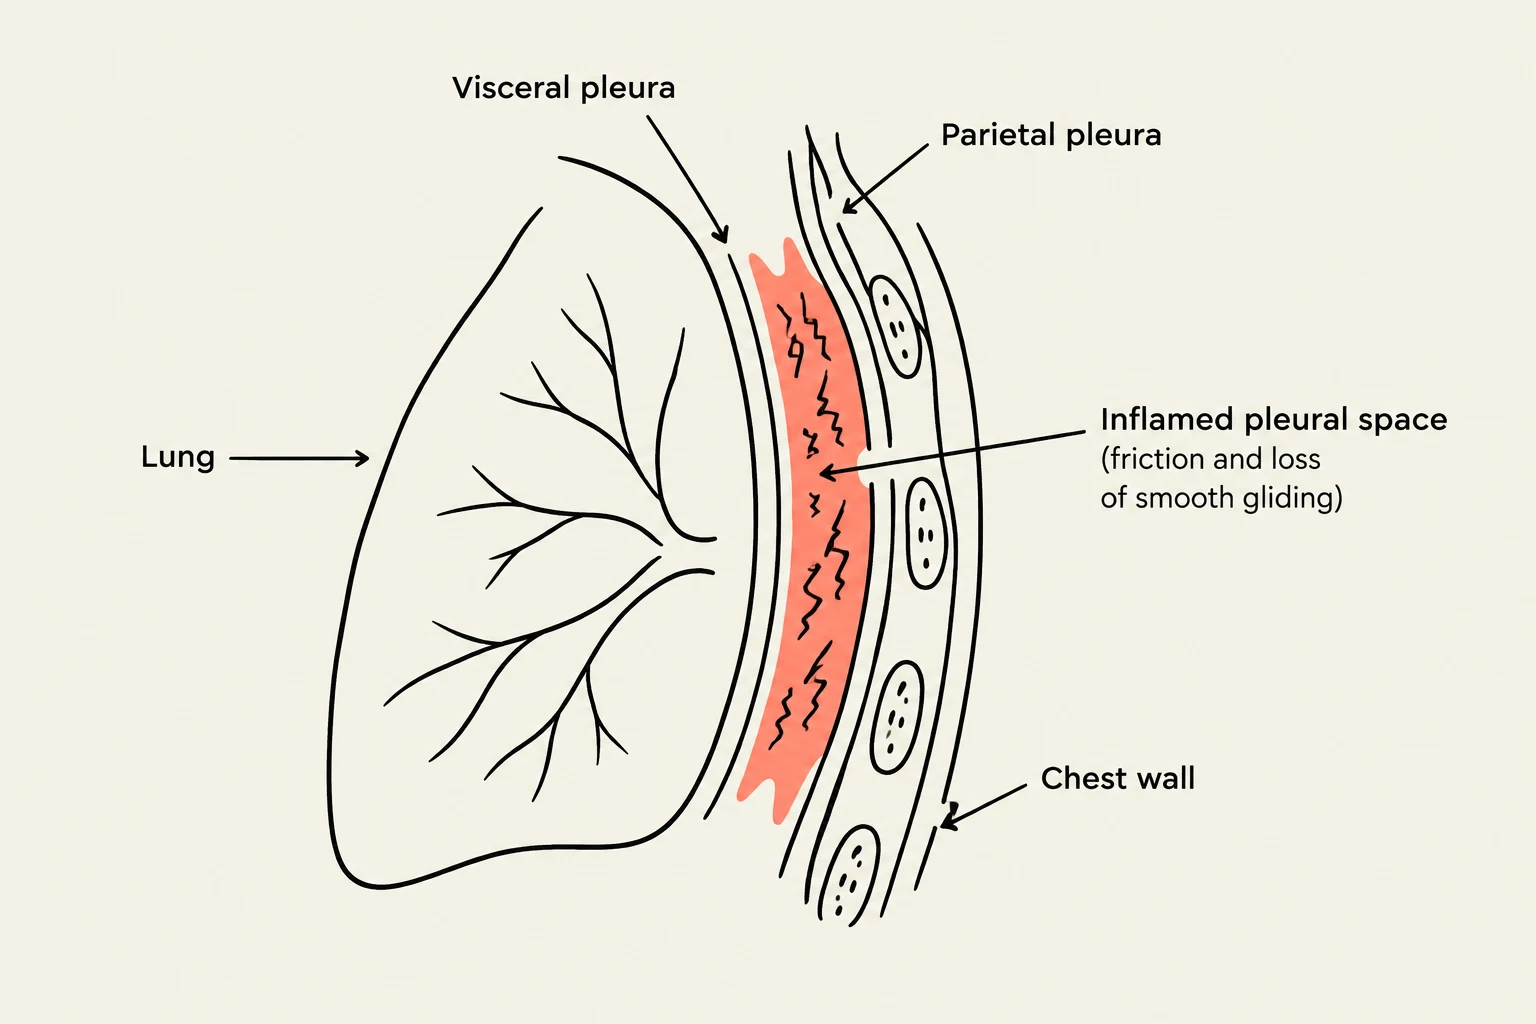
Diagram illustrating the visceral and parietal pleura, the inflamed pleural space, and the chest wall in relation to the lung.
Pleuritis, or pleurisy, is the inflammation of the pleura—the two thin layers of tissue that separate your lungs from your chest wall. When these layers become inflamed, they no longer glide smoothly against one another; instead, they rub together, causing sharp pain that often worsens with deep breathing or coughing.
Diagnostic Indicators
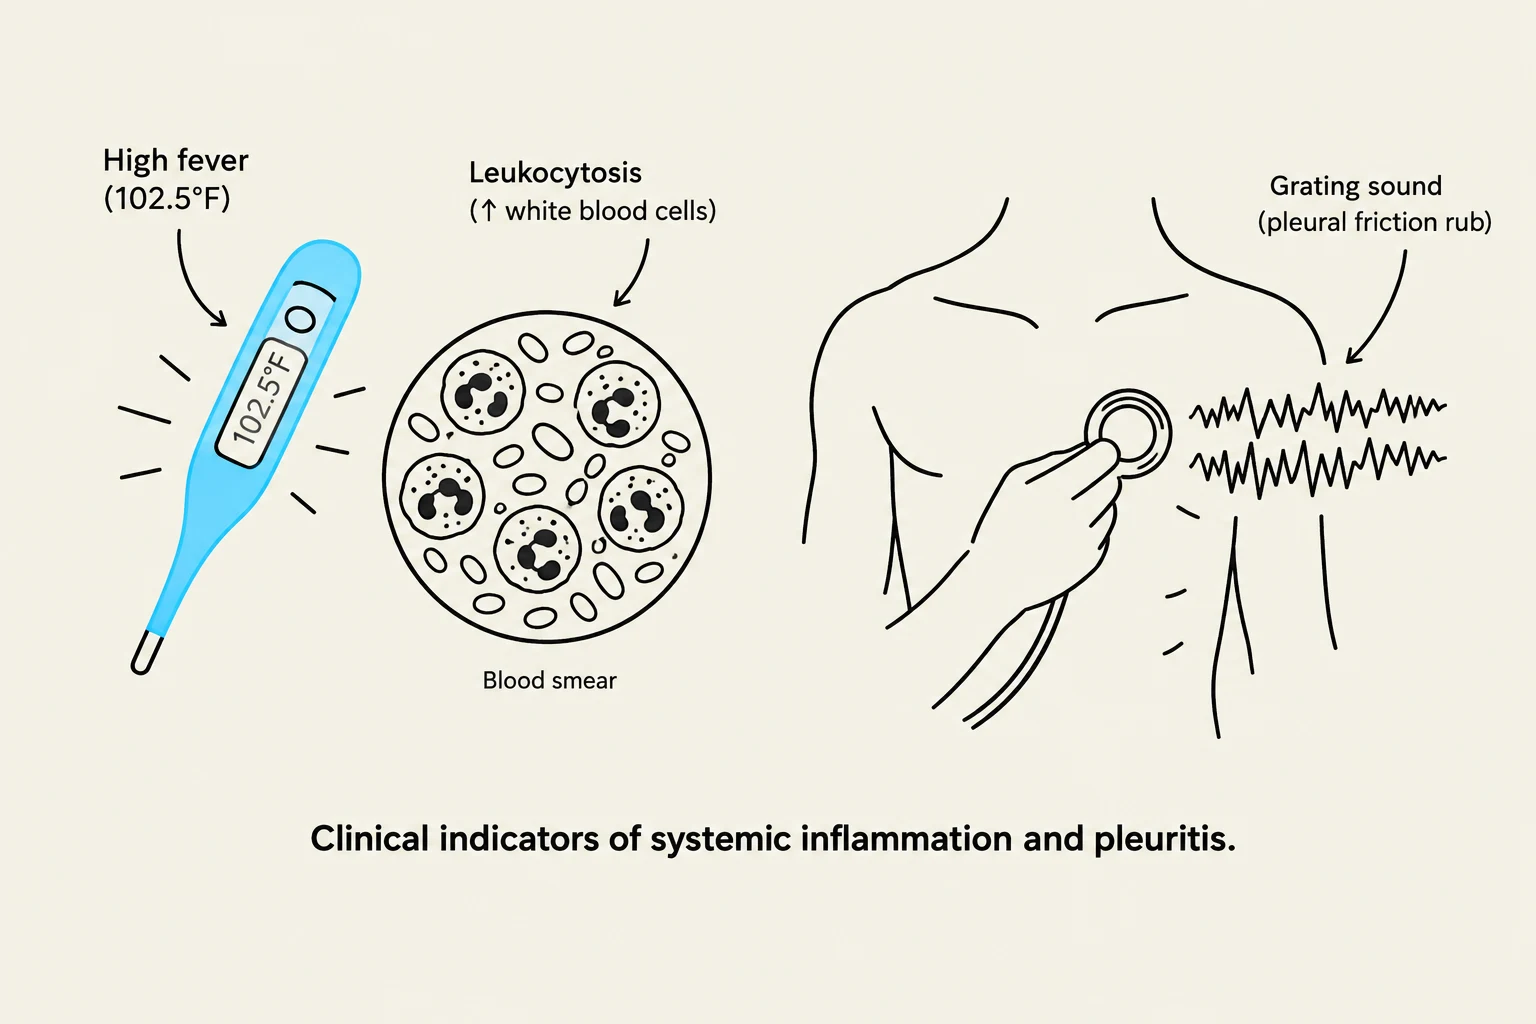
Clinical indicators of systemic inflammation and pleuritis, including high fever, leukocytosis (elevated white blood cells), and grating sounds (pleural friction rub) detected with a stethoscope.
In a clinical assessment, several key findings can point toward a diagnosis of pleuritis rather than a primary cardiac event:
Fever and Leukocytosis: The presence of a high temperature (e.g., 102.5°F) and an elevated white blood cell count (e.g., 20,000/µL) suggests an underlying inflammatory or infectious process.
The Friction Rub: One of the most pathognomonic physical exam findings is the friction rub. In the context of pleuritis, this is a grating or creaking sound heard during auscultation, often most noticeable when the patient holds their breath or moves in specific ways.
Worked Example: Emergency Department Presentation
Consider the following clinical scenario:
Patient Presentation: Severe chest pain.
Vital Signs: Temperature of 102.5°F.
Labs: WBC count of 20,000/µL.
Physical Exam: A friction rub is noted near the lower left sternal border when the breath is held.
Analysis: The combination of systemic inflammation (fever and high WBC) and the localized mechanical sound of a friction rub strongly indicates pleuritis. While chest pain can be cardiac in nature, the presence of the rub and the inflammatory markers shifts the differential diagnosis toward the pleural space.
Summary Table: EKG Waveform Components
EKG Component
Physiological Process
Clinical Significance
P Wave
Atrial Depolarization
Triggers atrial contraction
QRS Complex
Ventricular Depolarization
Triggers ventricular contraction
T Wave
Ventricular Repolarization
Represents electrical recovery
Keep reading for free.
Create an account to finish this reading and make it part of your study routine.