


In the field of public health, communication is much more than just sharing facts; it is the method by which we collect, compile, and present information to influence how people perceive, combine, and use data to make critical decisions. Whether a clinician is explaining the risks of a new treatment or a government agency is reporting on a disease outbreak, the way information is structured and visualized can fundamentally change the outcome of those decisions.
To communicate effectively, one must master two distinct areas: the technical methods of graphical presentation and an understanding of the psychological factors that influence how humans perceive risk.
Methods of Graphical Presentation
When presenting population-level data, such as mortality rates or disease prevalence, the choice of visual format is critical. There are three basic forms of graphical presentation used to make complex data sets digestible:
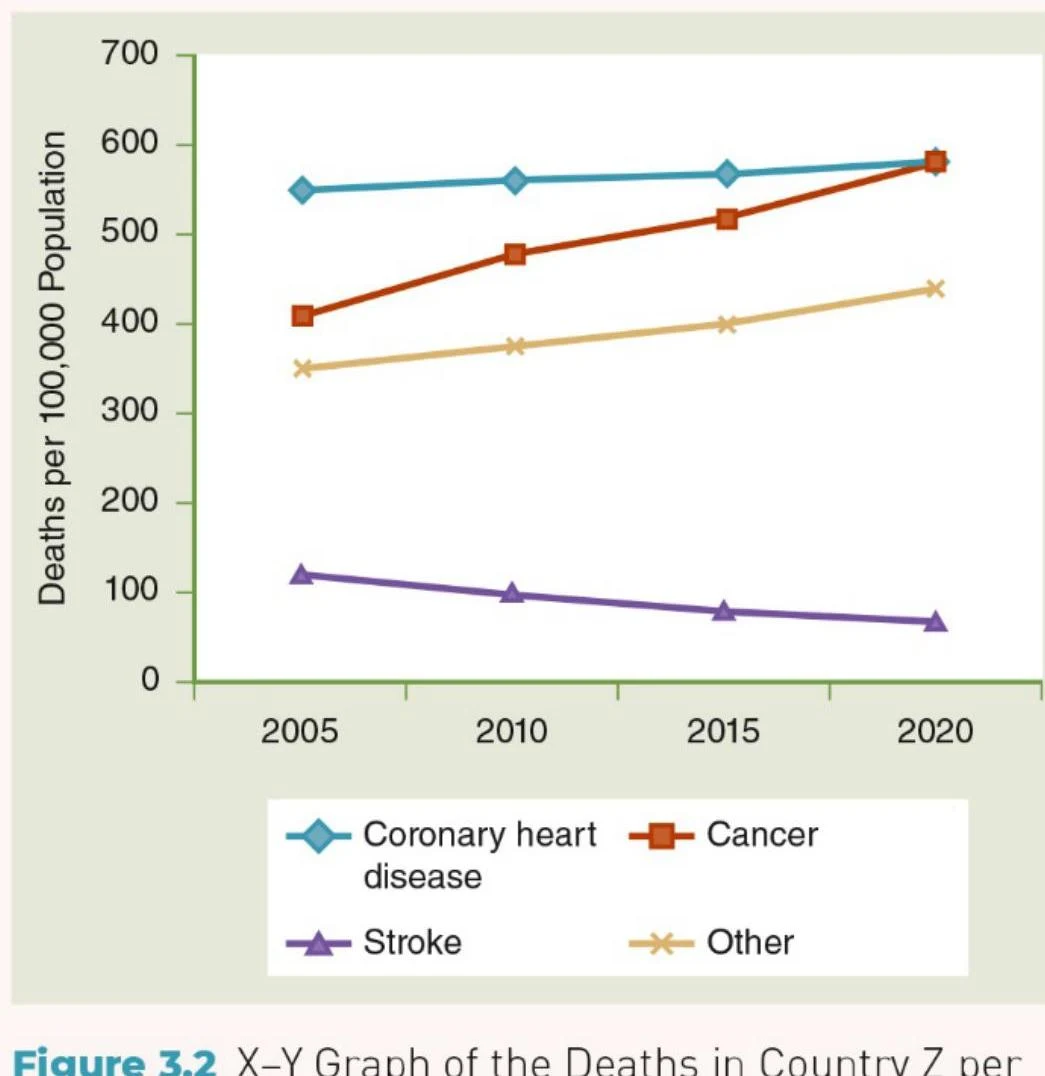
1. X-Y Graphics
X-Y graphics, often presented as line graphs, are ideal for showing trends over time. They allow the viewer to see whether a health metric is increasing, decreasing, or remaining stable across a specific period.
2. Geometric Graphics
Geometric graphics, such as column or bar charts, are highly effective for comparing different categories or showing the magnitude of change between specific points in time.

Keep reading for free.
Create an account to finish this reading and make it part of your study routine.
Continue reading freeAlready have an account? Log in
Updated