Economic Theories, Data, and Graphs: A Foundation for Analysis
This article explores the fundamental tools economists use to understand the economy, including the distinction between positive and normative statements, building and testing economic theories, analyzing economic data, and graphing economic relationships.
Economics is often perceived as a complex web of numbers and predictions, but at its core, it is a scientific discipline that relies on structured logic, empirical evidence, and visual representation. To understand how the economy functions, economists must navigate the distinction between objective facts and subjective opinions, build theoretical models to explain reality, and use diverse data sets to test those models. This article explores the fundamental tools used to turn economic observations into actionable knowledge.
Positive vs. Normative Statements
One of the most critical skills in economic analysis is distinguishing between what is and what ought to be. This distinction helps clarify whether a discussion is based on verifiable facts or personal values.
Positive Statements
Positive statements are objective descriptions of "what is, was, or will be". They deal with matters of fact and are testable using data, observation, or experiments. A positive statement does not have to be true to be considered "positive"; it simply must be a statement whose truth or falsehood can be demonstrated through evidence. For example, the statement "If Alberta increases the minimum wage, some jobs will be lost" is a positive statement because we can look at employment data to test its validity.
Normative Statements
Normative statements are subjective and involve value judgments regarding "what ought to be". These statements are based on personal values, ethics, or opinions and are inherently untestable through empirical data alone. For instance, saying "We should lower taxes" or "The mayor should resign" are normative statements because they express a preference rather than a provable fact.
Exam Tip: When analyzing a statement, ask yourself: "Can I prove this statement true or false using a dataset?" If yes, it is positive. If the answer depends on someone's opinion of what is "fair" or "good," it is normative.
Why Economists Disagree
Disagreements in economics often stem from these two categories. Many public debates are normative disagreements, where experts hold different values regarding policy goals. However, economists also disagree on positive statements when different theories attempt to explain the same phenomenon. These disagreements can arise because the economy is incredibly complex, or because a relationship might hold true in the long run but not in the short run.
Building and Testing Economic Theories
Because the real world is too complex to study all at once, economists create economic theories (or models). These are abstractions from reality that use variables, assumptions, and predictions to explain economic behavior.
The Structure of a Theory
A theory typically consists of:
Variables: These can be endogenous (explained within the theory) or exogenous (independent variables that come from outside the model).
Assumptions: Simplifications made to make the model workable.
Predictions: How the endogenous variables will change when the exogenous variables change.
For example, in a model of the Production Possibility Boundary (PPB), the amount of available resources is an exogenous variable, while the quantity of goods produced is an endogenous variable.
The Scientific Approach: Empirical Observation
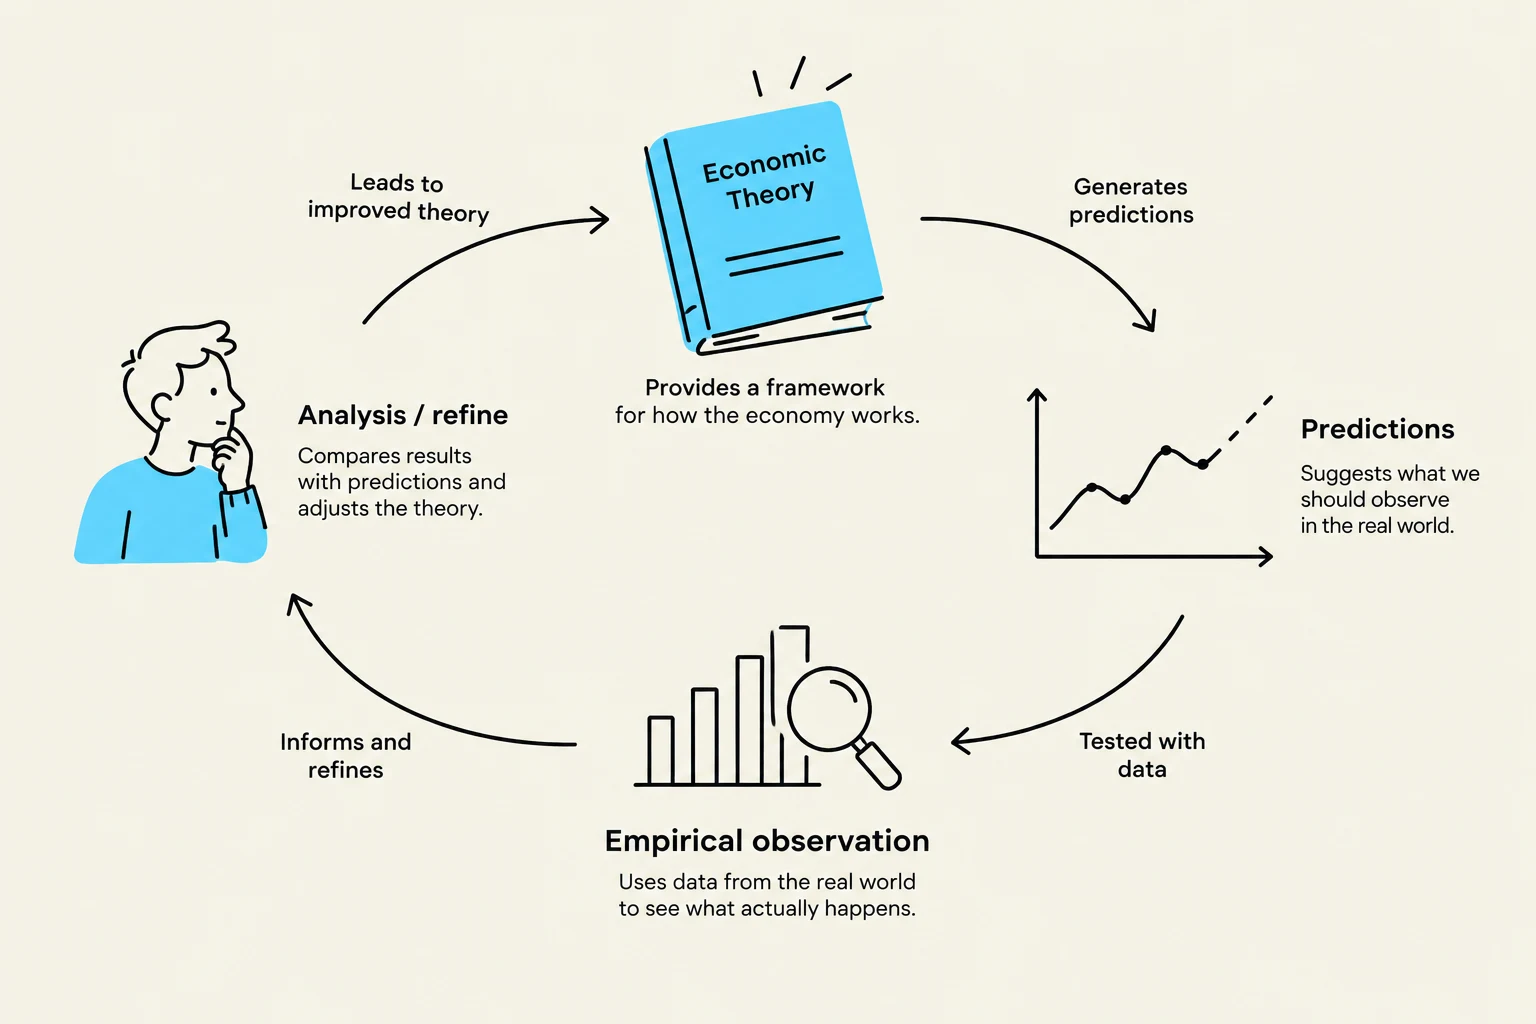
A theory is only useful if it can be tested. Economists use empirical observation to confront a theory's predictions with real-world evidence. If a theory's predictions conflict with the facts, the theory must be amended or discarded and replaced by a superior one. This creates a continuous cycle of building, testing, and refining.
This diagram illustrates the cyclical process of economic theory development, starting with a framework that generates predictions, which are then tested with data through empirical observation. The results inform and refine the analysis, leading to improved theory.
Economic Data and Statistical Analysis
To test theories, economists rely on various forms of economic data.
Types of Data
Index Numbers: These measure a variable relative to a base period, which is assigned the value of 100. A common example is the Consumer Price Index (CPI), used to track inflation.
Time-Series Data: Observations of a single variable over a period of time (e.g., the Canadian unemployment rate from 1978 to 2024).
Cross-Sectional Data: Observations of many different units (such as provinces or companies) at a specific point in time.
Correlation vs. Causation
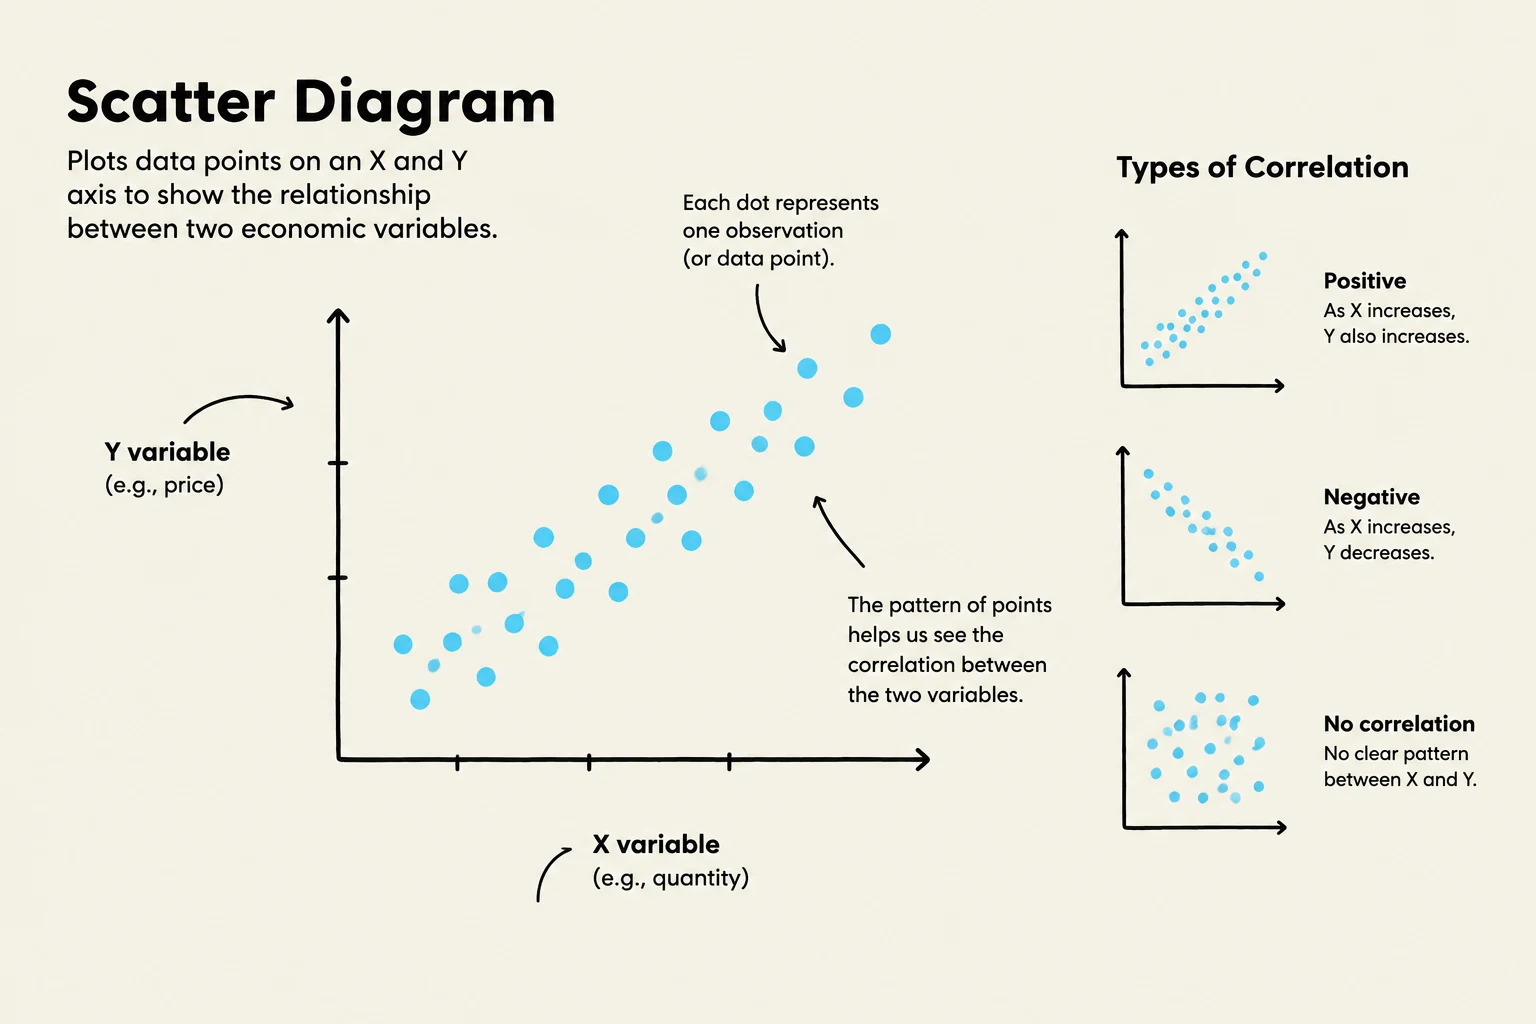
When analyzing data, economists often use scatter diagrams to visualize the relationship between two variables. While a scatter diagram might show a positive correlation (variables moving in the same direction) or a negative correlation (variables moving in opposite directions), correlation does not prove causation. For example, ice cream sales and crime rates both rise in the summer, but eating ice cream does not cause crime. Establishing causality often requires advanced statistical techniques or randomized controlled trials (RCTs).
Graphing Economic Theories
Graphs are essential tools for visualizing the mathematical relationships between variables. When one variable, Y, is related to another, X, we say Y is a function of X, written as:
Y=f(X)
Linear and Non-Linear Relationships
If the relationship between two variables is a straight line, they are linearly related. If the relationship is a curve, it is non-linear.
The Slope and Marginal Response
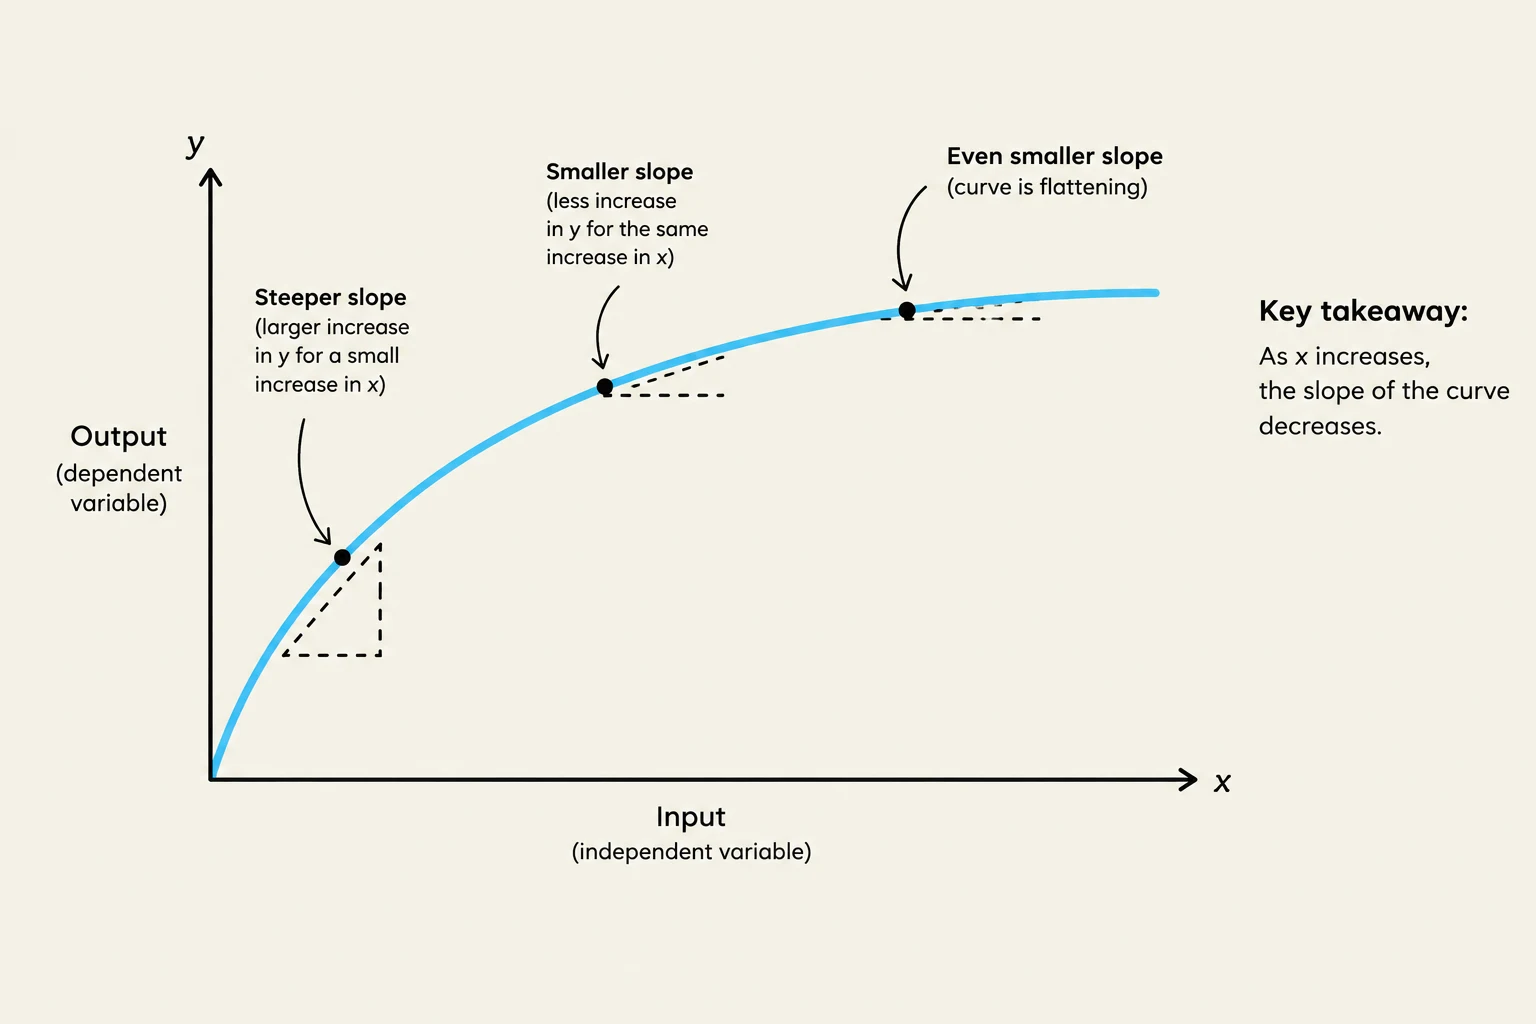
In a graph relating two variables, the slope of a line represents the marginal response of one variable to a change in the other. Mathematically, the slope is the change in the vertical axis variable divided by the change in the horizontal axis variable:
Slope=ΔEΔP
In non-linear functions, the slope changes as the value of X changes. This is often used to illustrate concepts like diminishing marginal response, where each additional unit of input results in a smaller change in the output.
A graph illustrating the concept of slope in a curve, showing how the slope decreases as the independent variable (x) increases, with labels for "Steeper slope", "Smaller slope", and "Even smaller slope".
A scatter diagram illustrates the relationship between two economic variables by plotting data points on an X and Y axis. It shows examples of positive, negative, and no correlation.
By combining theoretical models, rigorous data collection, and graphical analysis, economists can provide valuable insights to governments, businesses, and non-profits, helping them evaluate policies and manage economic risks.
Keep reading for free.
Create an account to finish this reading and make it part of your study routine.