Economic Growth Trends: Philippines Relative to Asian Neighbors
An analysis of the Philippines' Gross National Income (GNI) per capita growth from 1960 to 2025, comparing its absolute progress with relative stagnation compared to rapidly growing East and Southeast Asian economies. Explores the divergence, bottlenecks in productivity and labor, and key economic metrics like GDP and
When we discuss the economic health of a nation, we often look at how much money is being made. However, looking at a single number in isolation can be misleading. To truly understand a country's economic standing, we must look at its Gross National Income (GNI) per capita in the context of its neighbors. For the Philippines, the story is one of absolute progress but relative stagnation. While the nation has successfully climbed into the "upper-middle income" bracket, it has simultaneously lost much of its competitive edge to the rapid economic engines of East and Southeast Asia.
Understanding the Metrics: GNI vs. GDP
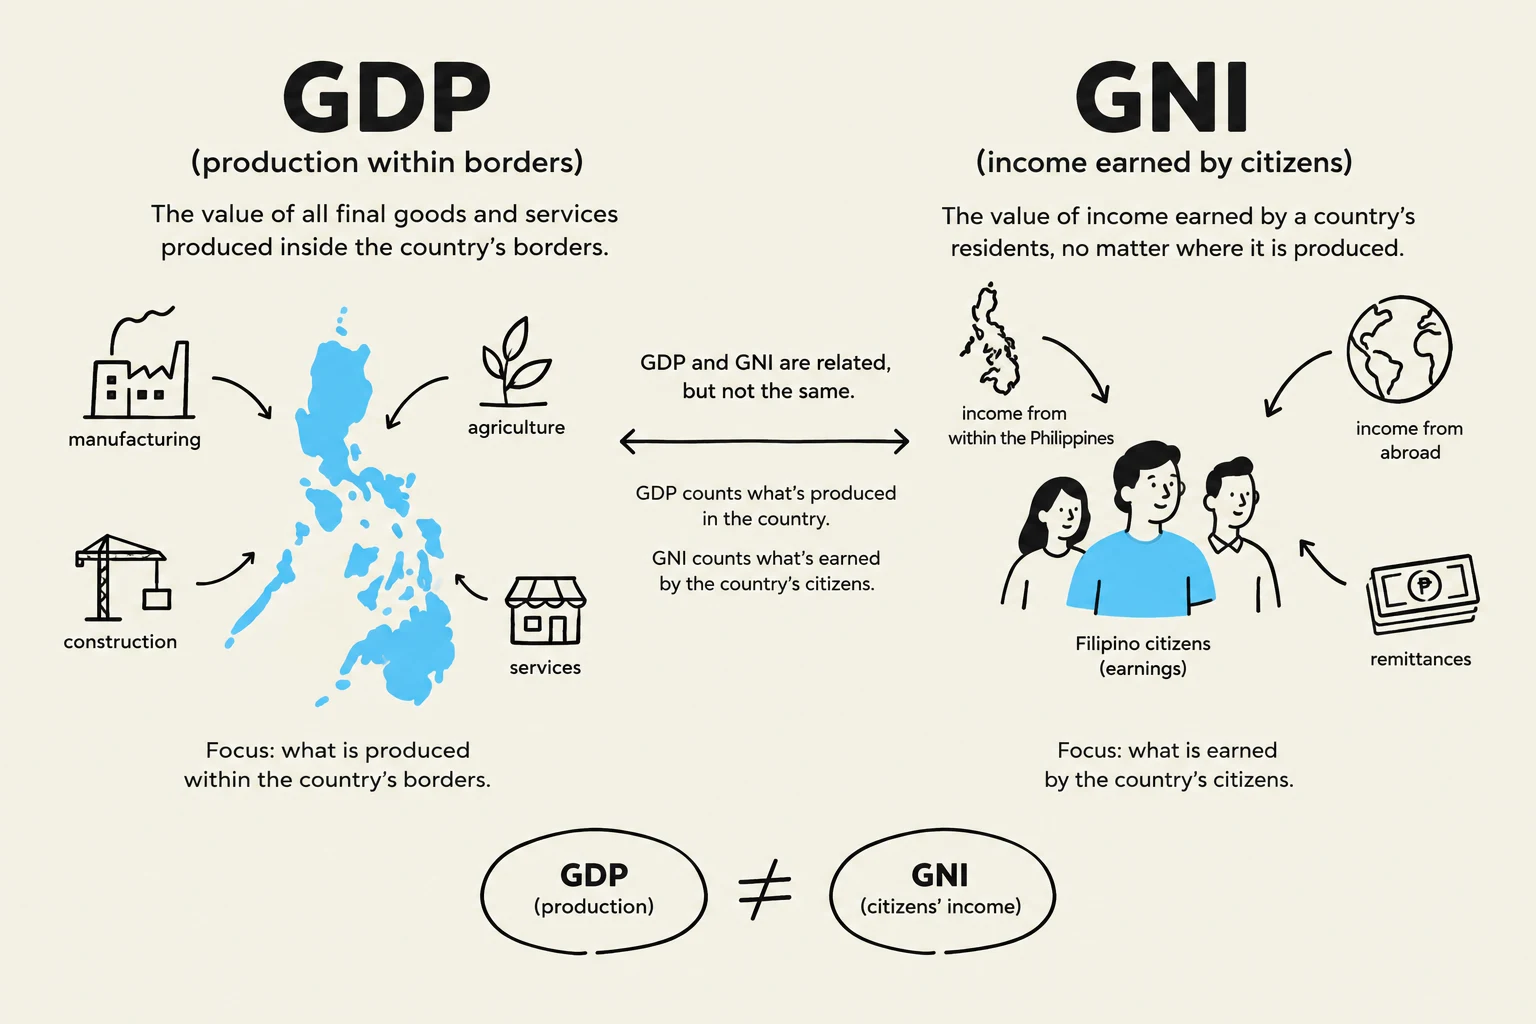
Before diving into the trends, it is essential to distinguish between the two most common ways we measure economic output: Gross Domestic Product (GDP) and Gross National Income (GNI).
GDP per capita measures the total value of all goods and services produced within a country's borders. In contrast, GNI per capita measures the total income earned by a nation's residents, regardless of where that income is generated. This difference is crucial because it accounts for "Net Income from Abroad"—the money flowing in from overseas workers (remittances) or investments made by citizens in other countries.
To make these numbers comparable across different eras and countries, economists use Purchasing Power Parity (PPP). Instead of just looking at raw exchange rates, PPP adjusts for the cost of living and the "purchasing power" of a dollar in a specific country. When we speak of "2025 prices and PPP$," we are essentially asking: "How much stuff could a person in the Philippines actually buy with their income, adjusted to the value of a dollar in the year 2025?".
This illustration explains the difference between Gross Domestic Product (GDP) and Gross National Income (GNI). GDP measures the total value of goods and services produced within a country's borders, encompassing manufacturing, agriculture, construction, and services. GNI, on the other hand, measures the income earned by a country's citizens, regardless of where it is produced, including income from within the country, income from abroad, and remittances.
Exam Tip: If a question asks why the Philippines' GNI might be higher than its GDP, look for high levels of remittances from Overseas Filipino Workers (OFWs). Remittances increase GNI because they represent income earned by citizens, even if the production happened elsewhere.
The Great Divergence: 1960–2025
The most striking aspect of the Philippine economic trajectory is the "multiplier effect" observed in neighboring countries. Between 1960 and 2025, the Philippines' GNI per capita (in 2025 PPP$) grew by a factor of only 4x. While this represents significant growth, it pales in comparison to the explosive transformations seen in the "Asian Tigers" and other regional peers.
Consider the following growth multipliers over the same 65-year period:
South Korea: 36x growth
Thailand: 11x growth
Malaysia: 10x growth
Indonesia: 8x growth
This data highlights a "relative growth gap." While the Philippines was moving forward, its neighbors were sprinting. This divergence is often attributed to different economic strategies, ranging from export-oriented industrialization to massive investments in human capital and technology.
Reversing the Lead: The China and Vietnam Factor
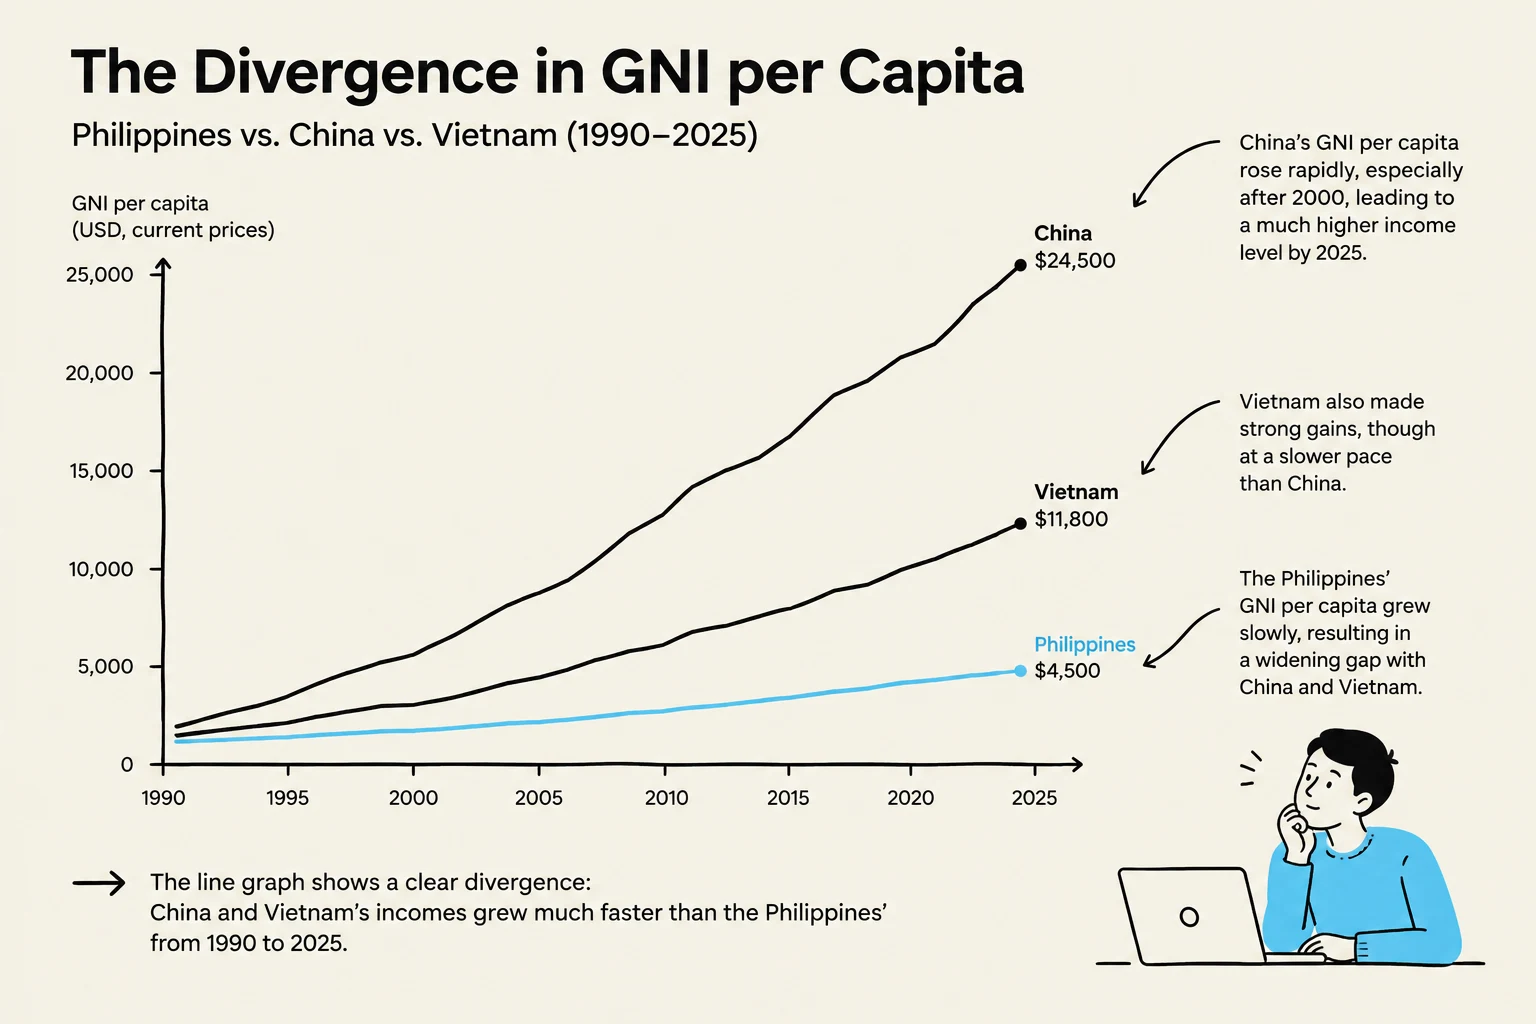
In 1990, the Philippines was an economic leader in the region compared to the emerging giants of China and Vietnam. At that time, the Philippines' GNI per capita was approximately 3x that of China and 2x that of Vietnam.
However, the late 20th and early 21st centuries saw a dramatic reversal. As China and Vietnam integrated more deeply into global supply chains, their growth rates skyrocketed. By 2025, China's GNI per capita had grown by 17x and Vietnam's by 7x, while the Philippines managed only a 3x increase.
As of 2025, the hierarchy has shifted significantly. According to World Bank classifications, the Philippines has finally entered the upper-middle income group, with a GNI per capita of approximately $4,850. Yet, it now sits below China, Malaysia, Thailand, and Indonesia in terms of per capita income. Interestingly, Vietnam has almost caught up, with a GNI per capita of $4,970, having reached the upper-middle income threshold much faster than the Philippines.
This line graph illustrates the divergence in Gross National Income (GNI) per capita between the Philippines, China, and Vietnam from 1990 to 2025, showing significantly faster income growth in China and Vietnam compared to the Philippines.
Identifying the Bottlenecks: Productivity and Labor
Why did this stagnation occur? To answer this, we must look at two critical drivers of economic growth: Labor Productivity and the Employment-to-Population Ratio.
1. The Productivity Gap
Economic growth is fundamentally driven by how much value a worker can produce in a given hour. While the Philippines has seen productivity increases, they have been significantly lower than those of its neighbors. For example, in 2023, South Korea's productivity was over $91,000 (PPP$), while the Philippines lagged at approximately $23,608.
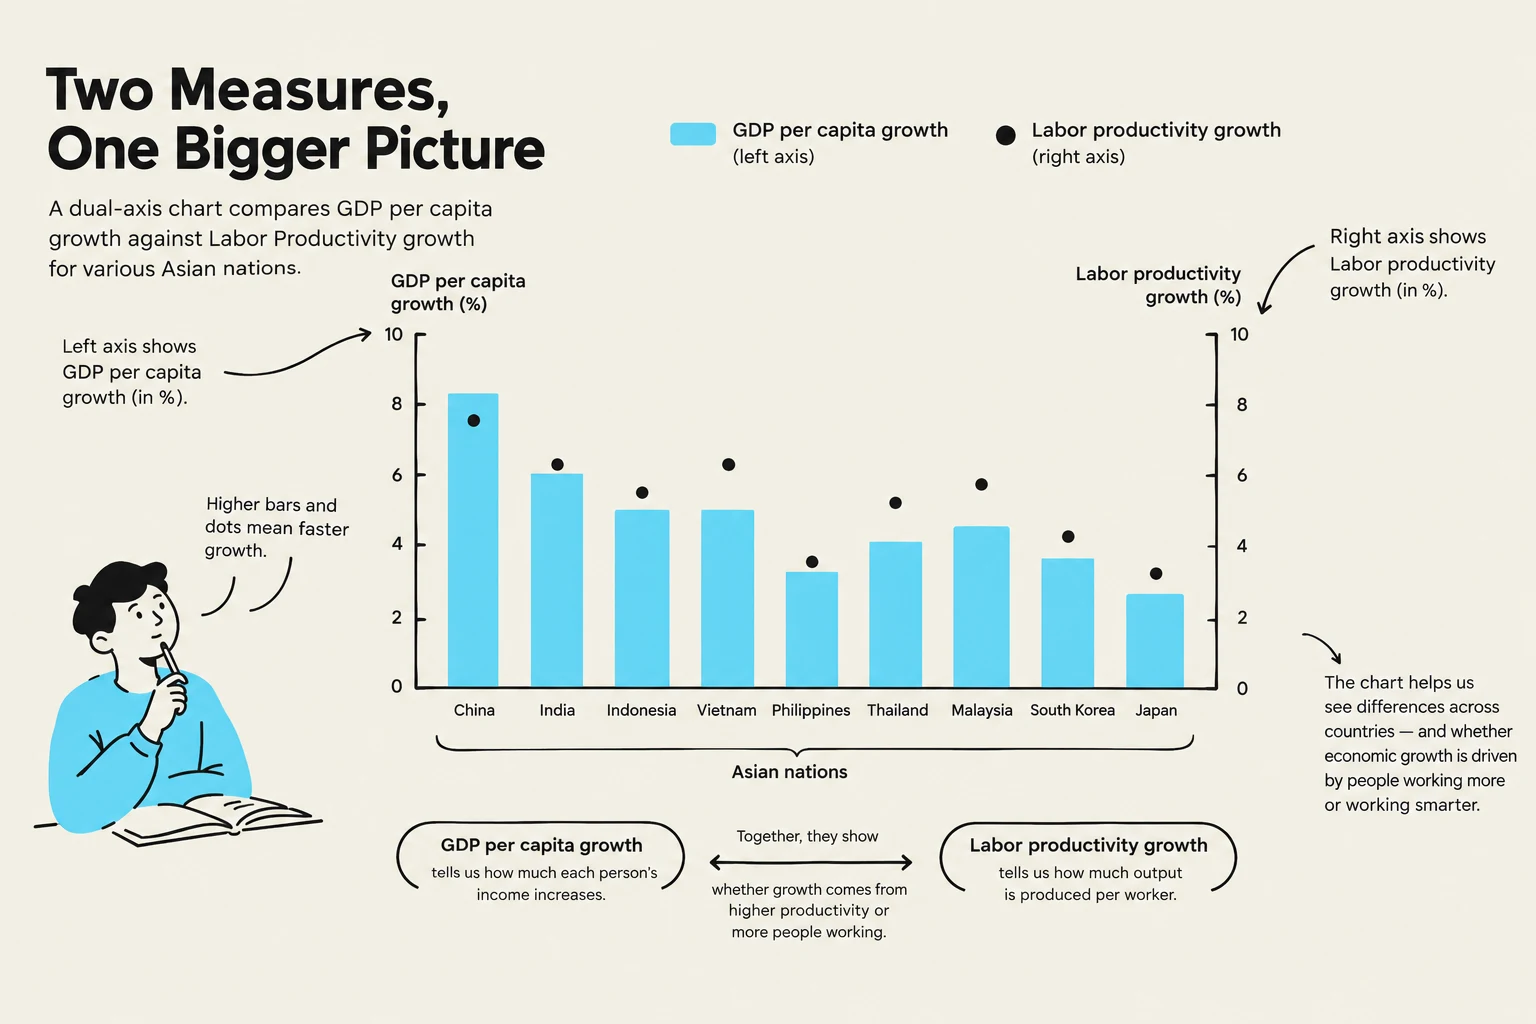
The relationship between GDP per capita and productivity can be understood through the following conceptual relationship:
Real GDP per capita≈Labor Productivity×Employment-to-Population Ratio
If productivity is low, even a large workforce cannot drive high levels of national income.
2. Labor Force and Employment Trends
The Philippines also faces challenges regarding how effectively its population is utilized. The employment-to-population ratio in the Philippines (approximately 41.1% in 2023) is notably lower than in Vietnam (55.6%) or Thailand (55.6%).
Furthermore, demographic shifts are emerging. The fertility rate in the Philippines has been declining, reaching a record low that is now below the replacement ratio. This suggests that the "demographic dividend"—the period where a large working-age population drives growth—may be shorter or less impactful than expected, as fewer youth cohorts will enter the workforce in the coming decades.
This chart compares GDP per capita growth and labor productivity growth for various Asian nations, illustrating economic growth drivers.
Summary of Findings
The historical trajectory of the Philippines reveals a nation that is growing, but not fast enough to keep pace with the rapid modernization of its neighbors. The transition from a lower-middle to an upper-middle income economy is a milestone, but the "stagnation of relative growth" remains a critical concern. To bridge this gap, economic policy must move beyond mere expansion and focus on the structural drivers of wealth: increasing labor productivity and optimizing employment across the population.
Key Takeaway for Students: When analyzing economic trends, always distinguish between absolute growth (the country is getting richer) and relative growth (the country is getting richer faster or slower than its neighbors). The Philippines is experiencing the former, but struggling with the latter.
Keep reading for free.
Create an account to finish this reading and make it part of your study routine.