This reading explains the scientific method as applied to ecology, including hypothesis testing, replication, randomization, statistical inference, and different experimental approaches. It also covers population dynamics and the use of mathematical models to predict population size.
Ecology is the scientific study of how organisms—ranging from microscopic bacteria to massive plants and animals—interact with one another and their physical environments. Because life is not distributed evenly across the Earth, ecologists must work to explain the patterns of abundance and distribution they observe. To move from a simple observation of a pattern to an understanding of the underlying biological processes and mechanisms, researchers rely on the rigorous application of the scientific method.
The Scientific Method and Hypothesis Testing
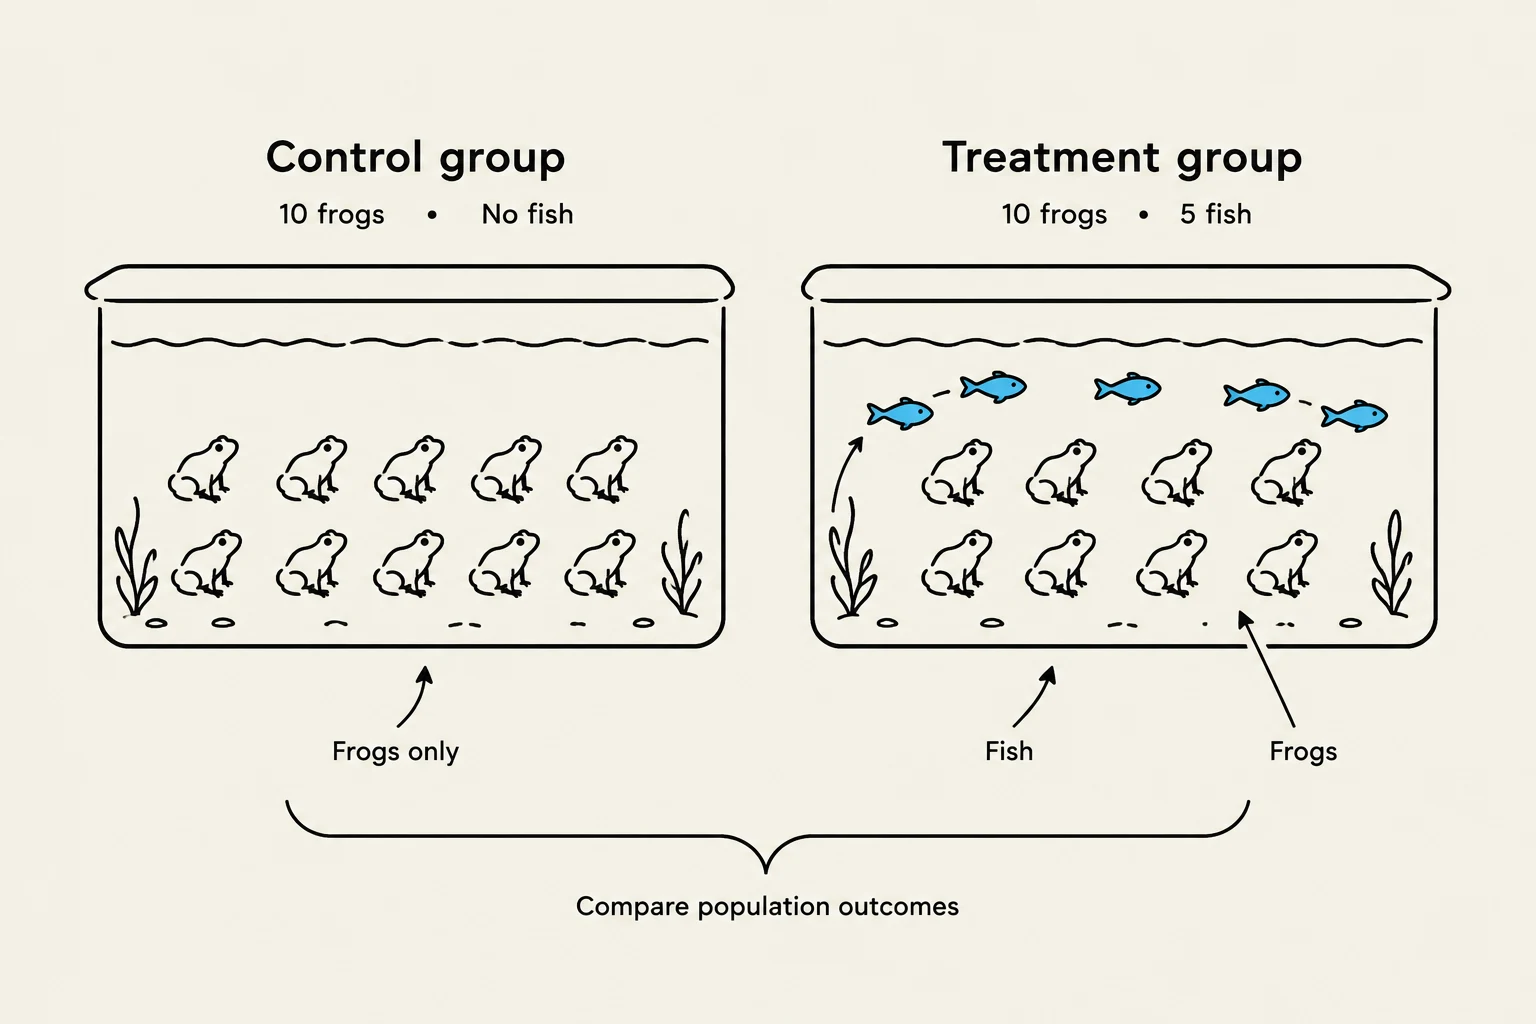
At the heart of ecological research is the formulation of a hypothesis: an idea about how the natural world works. For example, an ecologist might observe that ponds containing fish have fewer frogs than ponds without fish. To test this, they must develop two competing statements:
The Null Hypothesis (H0): This assumes that the variable being studied has no effect. In our example, H0 would state that fish presence has no effect on frog population size.
The Alternative Hypothesis (H1): This predicts a specific outcome or effect. Here, H1 would state that fish presence reduces the frog population size.
Experiments are designed to test these predictions by independently manipulating one or few variables while establishing appropriate control treatments. A control treatment provides a baseline for comparison, allowing researchers to see what happens when the experimental variable (such as the presence of fish) is absent.
This diagram illustrates a scientific experiment comparing population outcomes in two groups of frogs. The control group contains 10 frogs with no fish, while the treatment group contains 10 frogs and 5 fish.
Ensuring Reliability: Replication and Randomization
Because nature is inherently variable, a single experiment is rarely enough to prove a point. To ensure that results are not simply due to chance, ecologists employ two critical strategies:
Replication: Instead of testing one pond, researchers test many ponds (e.g., multiple "fish" ponds and multiple "no fish" ponds) to see if the pattern holds true across different instances.
Randomization: This involves assigning experimental units (like ponds or plots of land) to treatments randomly, which helps prevent bias and ensures that any observed effects are likely due to the treatment rather than pre-existing differences in the environment.
Exam Tip: Remember that in science, we don't "prove" a hypothesis; we either "strengthen" it if observations confirm our predictions, or "weaken/reject" it if they do not.
Statistical Inference and Probability
To determine if the differences observed between a control and a treatment group are meaningful, ecologists use probability theory. When analyzing data, researchers often report the mean (average) alongside the Standard Error (SE), which describes the variability or uncertainty in the data.
The most important metric in this process is the P-value. This value tells us the probability that the observed pattern occurred by chance alone. By scientific convention, if a P-value < 0.05, the results are considered statistically significant. This means there is less than a 5% chance that the results were a random fluke, allowing researchers to reject the null hypothesis.
Experimental Approaches in Ecology
Ecologists choose their experimental design based on the scale of the question and the feasibility of manipulation. There are three primary types of experiments:
Laboratory Experiments: These are conducted in highly controlled settings where variables can be strictly managed.
Field Experiments: These take place in natural environments where researchers manipulate specific variables (like adding nutrients to a forest plot) while allowing other natural processes to continue.
Natural Experiments: These occur when researchers conduct comparative observations of existing conditions that were changed by natural events rather than human intervention.
Sometimes, the scale of a system is too large for direct manipulation (such as studying the entire ocean or a global forest). In these cases, ecologists use alternative tools:
Microcosms: These are small-scale systems that replicate the essential features of a larger environment in a lab or field setting.
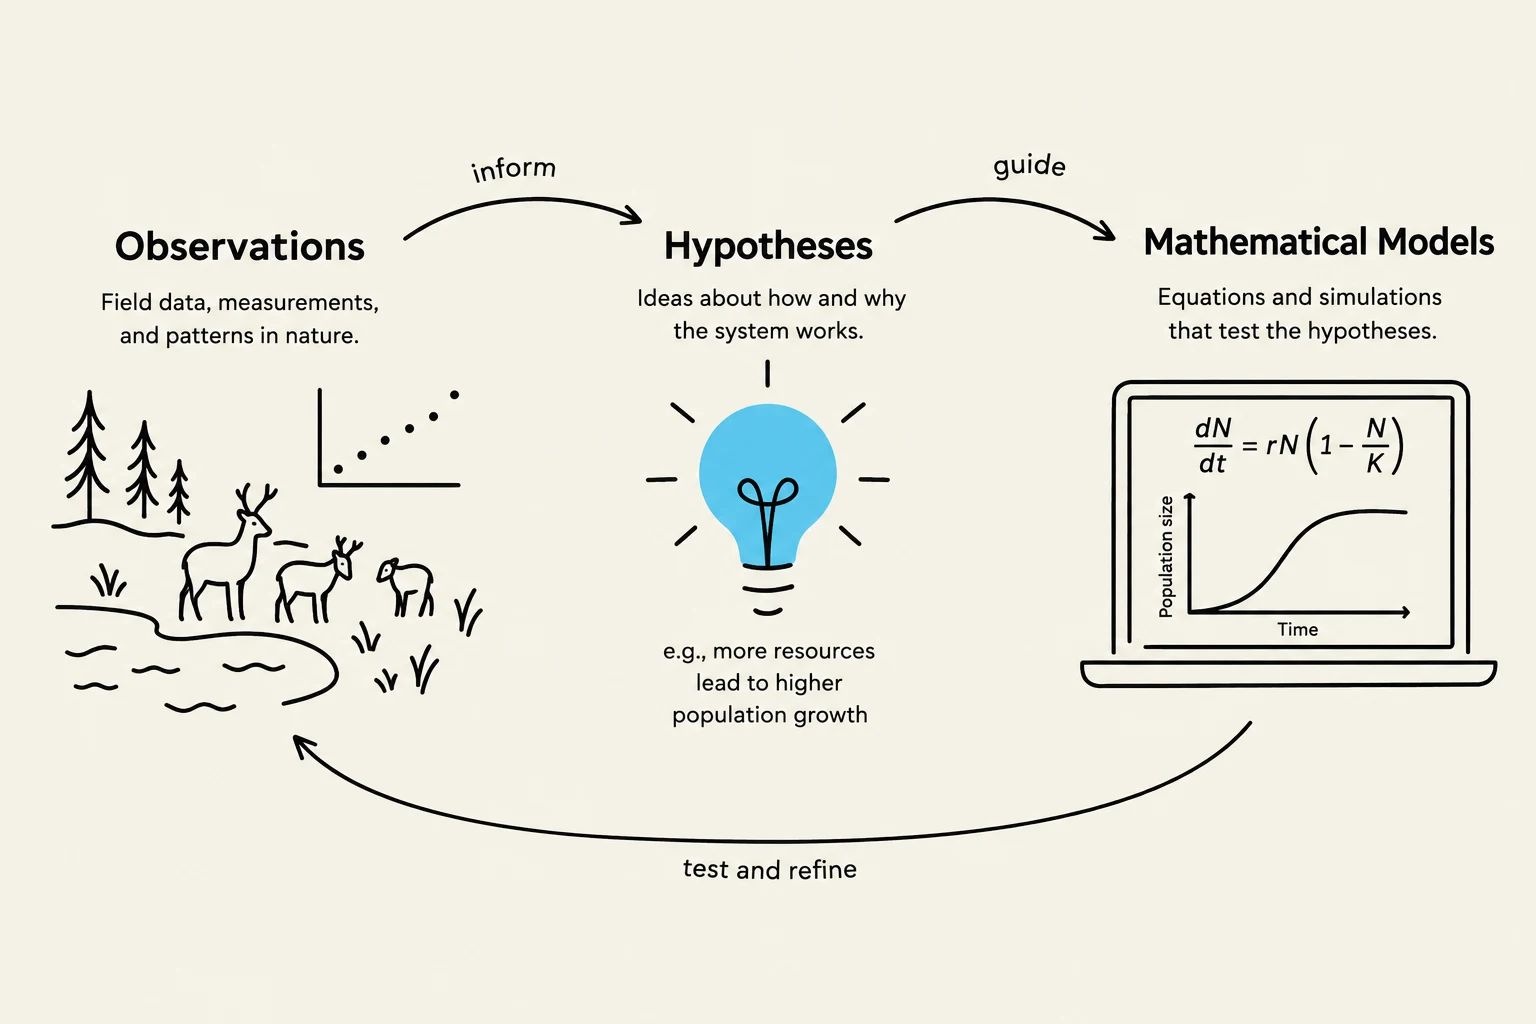
Mathematical Models: These are powerful representations of systems using sets of equations. A model acts as a testable hypothesis that can yield predictions about complex phenomena, such as the spread of a disease or the global carbon cycle.
This diagram illustrates the scientific method, showing how observations inform hypotheses, which are then tested and refined using mathematical models, with an example of population growth.
Population Dynamics and Mathematical Modeling
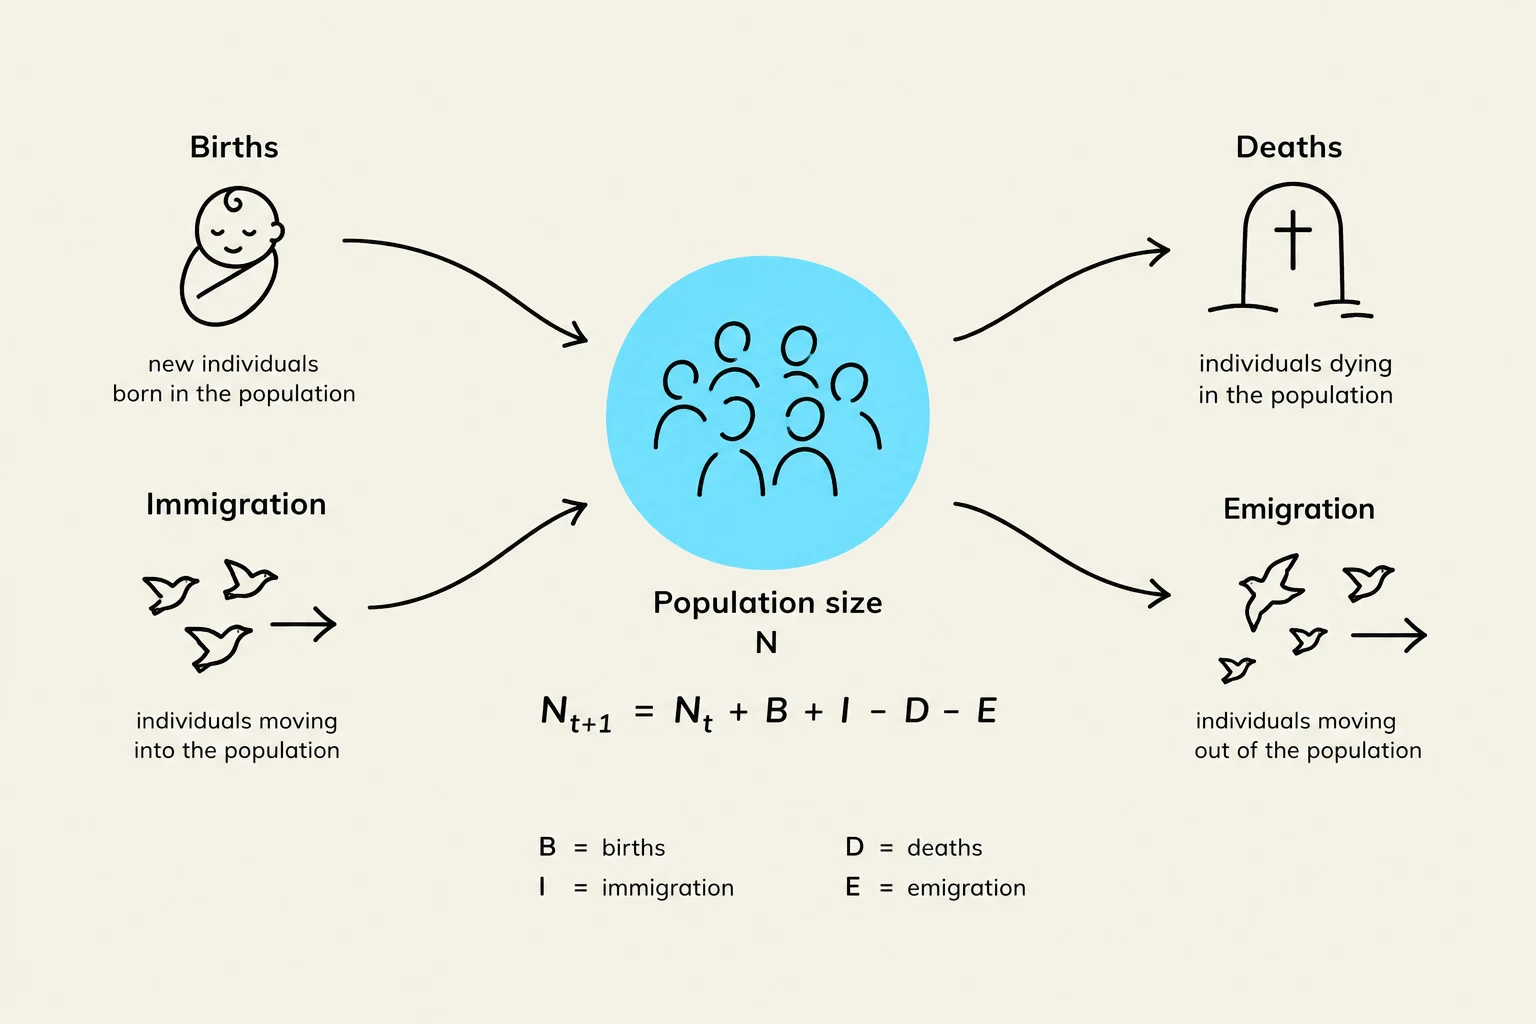
One of the most fundamental applications of mathematical modeling is predicting population size (N). A population consists of individuals of the same kind living together, and its size is constantly fluctuating based on the balance of gains and losses.
The change in population size can be expressed by the following relationship:
N=B+I−D−E
Where:
B = Births (gains)
I = Immigration (gains from individuals moving into the population)
D = Deaths (losses)
E = Emigration (losses from individuals moving out of the population)
By integrating experimental data with these mathematical frameworks, ecologists can move from observing a single organism in its habitat (its physical "address") to understanding the complex interactions within the entire biosphere—the global ecosystem encompassing all organisms and environments on Earth.
This diagram illustrates the factors affecting population size, including births, immigration, deaths, and emigration, along with the corresponding mathematical formula for population change.
Key Concept Check: While a habitat is where an organism lives, its niche is its ecological role—the "occupation" it holds within the community, including the specific conditions it tolerates and its functional role.
Keep reading for free.
Create an account to finish this reading and make it part of your study routine.