Diabetes Diagnosis Methods and Glycosylated Hemoglobin
This content explains the four primary methods used to diagnose diabetes mellitus: Hemoglobin A1C (HbA1C), Fasting Plasma Glucose (FPG), Oral Glucose Tolerance Test (OGTT), and Random Plasma Glucose. It details the diagnostic thresholds, requirements, and confirmation needed for each test, along with recognizing sympto
Diabetes mellitus is a chronic metabolic disorder characterized by hyperglycemia (high blood glucose levels) resulting from defects in insulin secretion, insulin action, or both. Because uncontrolled blood glucose can lead to severe microvascular and macrovascular complications—ranging from kidney failure to stroke—accurate diagnosis is the critical first step in management. Clinicians utilize four primary methods to diagnose diabetes, each serving a specific role depending on the patient's clinical presentation and history.
Hemoglobin A1C (HbA1C) and Glycosylated Hemoglobin
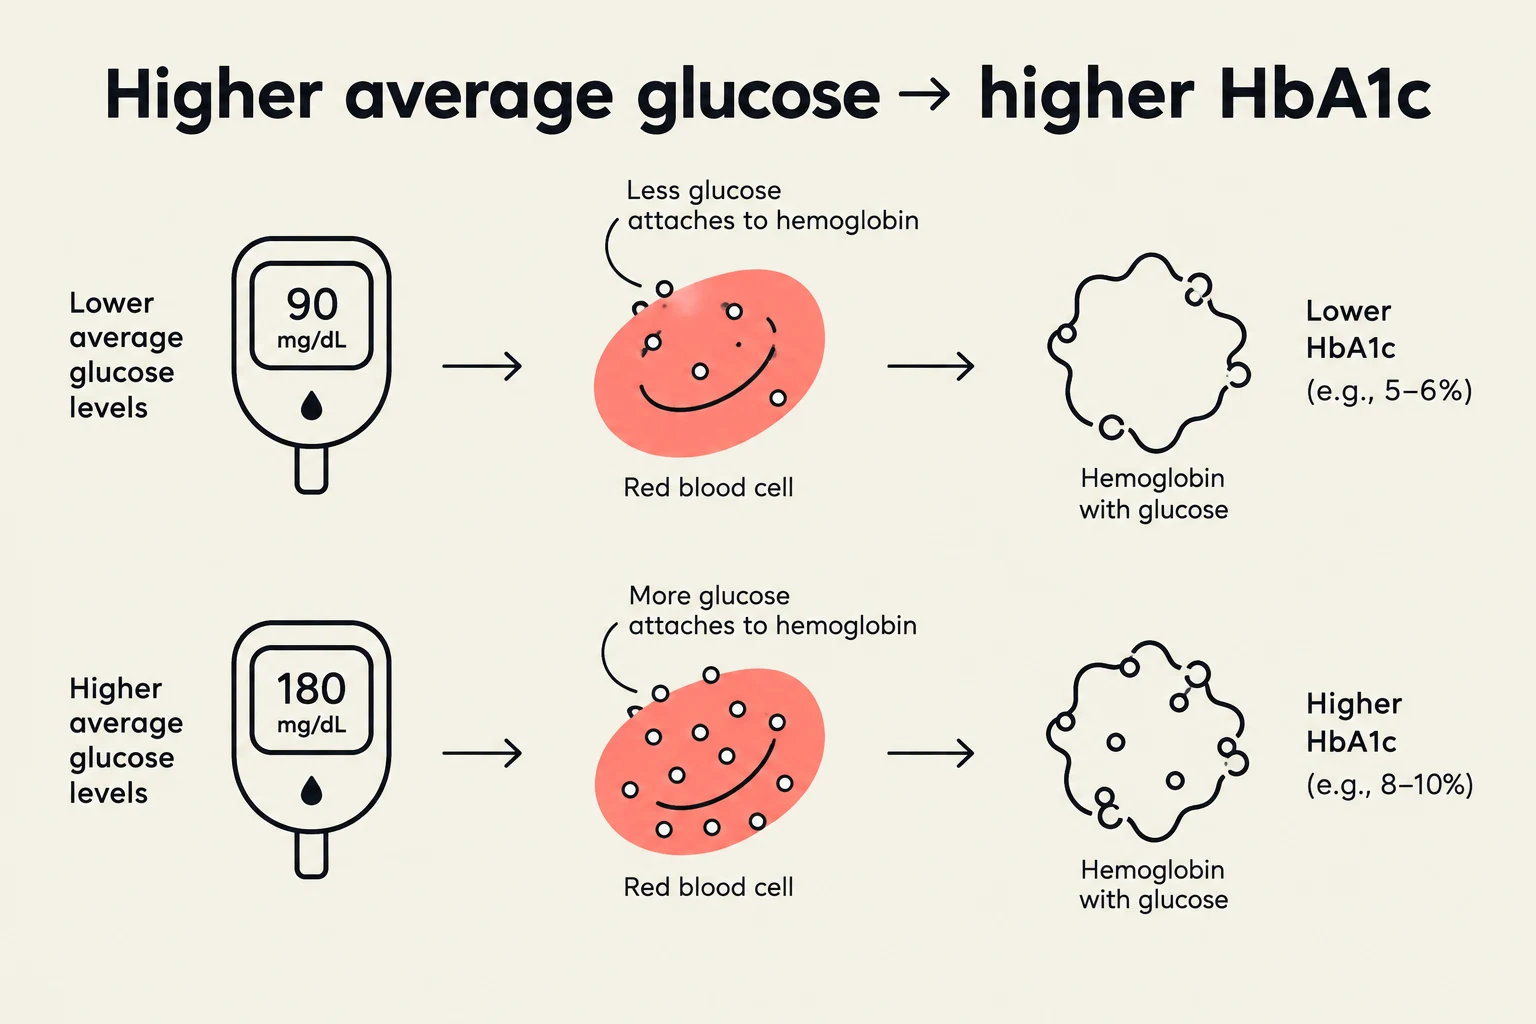
One of the most common diagnostic tools is the Hemoglobin A1C (HbA1C) test. This test measures the amount of glycosylated hemoglobin in the blood, which refers to glucose that has chemically bound to the hemoglobin molecules within red blood cells.
Because red blood cells have a finite lifespan, the HbA1C level provides a "snapshot" of average glucose control over the preceding several months. A significant clinical advantage of this test is that it does not require the patient to be fasting.
Diagnostic Thresholds and Goals
The diagnostic threshold for diabetes is an HbA1C≥6.5%. However, a single high reading is typically not enough; repeat testing is required to confirm the diagnosis. Once a patient is diagnosed, the clinical focus shifts from diagnosis to management:
Therapeutic Goal: For most patients with diabetes, the target is ≤7%.
Controlled Diabetes: Levels between $4%$ and $6%$ are generally considered representative of well-controlled diabetes.
This diagram illustrates the relationship between average blood glucose levels and HbA1c levels. Higher average glucose levels lead to more glucose attaching to hemoglobin in red blood cells, resulting in a higher HbA1c reading. Conversely, lower average glucose levels result in less glucose attaching to hemoglobin, leading to a lower HbA1c reading.
Exam Tip: Remember that HbA1C reflects long-term control (months), whereas a finger-stick glucose test reflects immediate, real-time levels.
Fasting Plasma Glucose (FPG)
The Fasting Plasma Glucose (FPG) test is a direct measure of blood sugar after a period of caloric restriction. For a test to be considered a true FPG, the patient must have had no caloric intake for at least 8 hours.
A plasma glucose level of ≥126 mg/dL (7.0 mmol/L) is diagnostic of diabetes. Like the HbA1C, this result must be confirmed by repeat testing to rule out potential laboratory errors.
Oral Glucose Tolerance Test (OGTT)
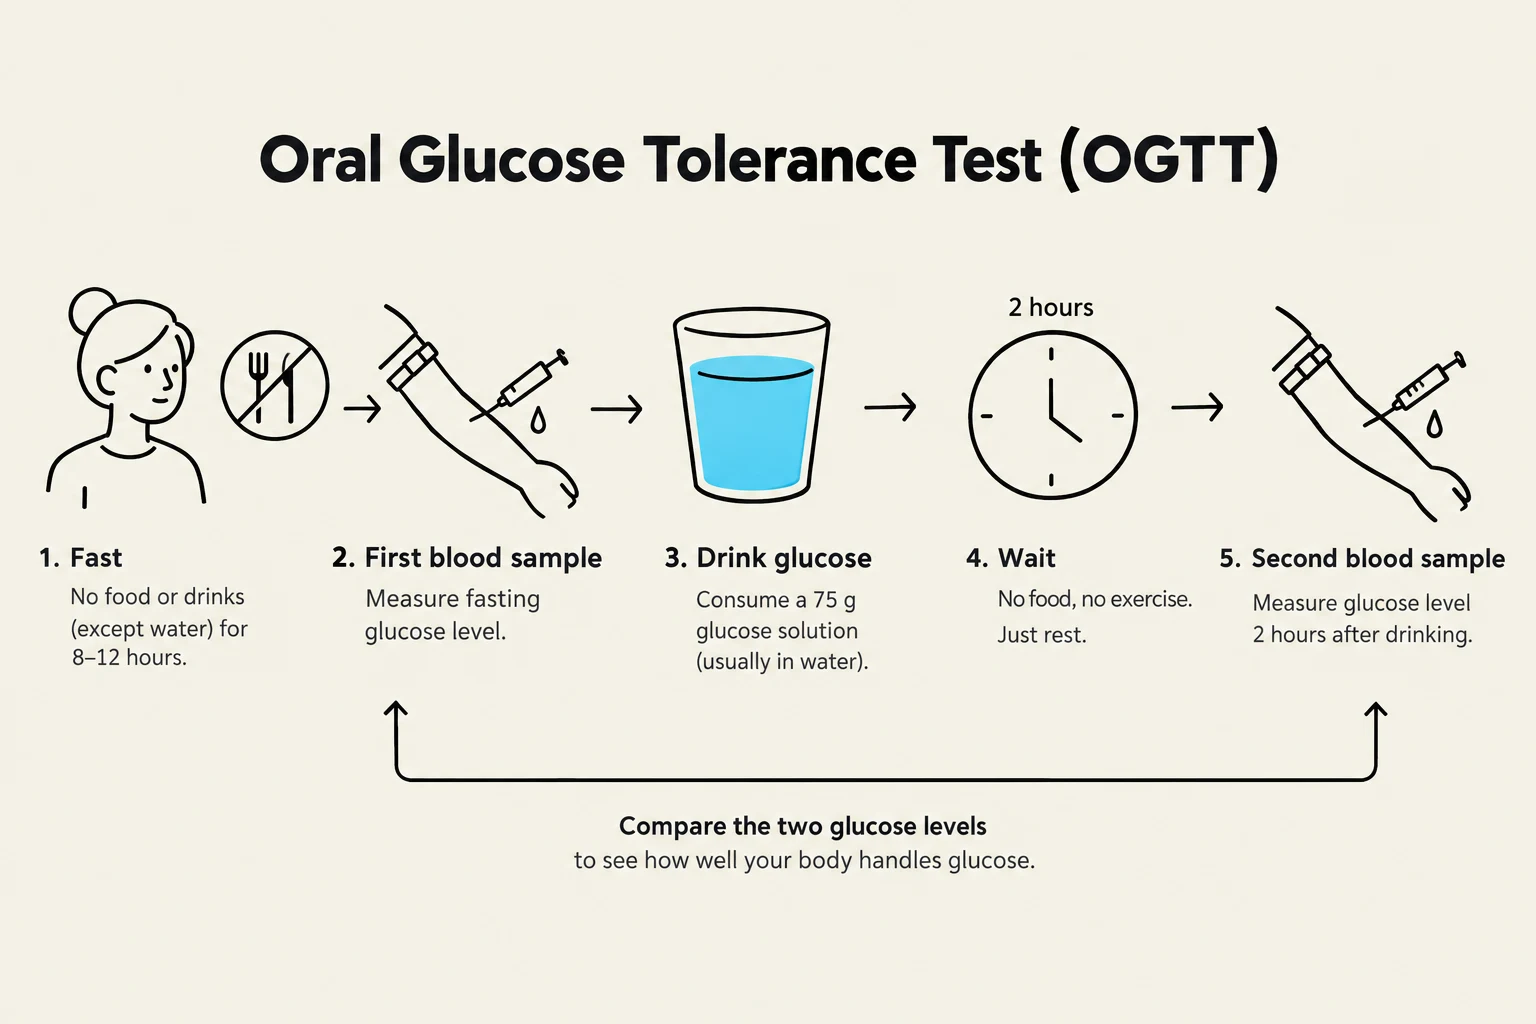
The Oral Glucose Tolerance Test (OGTT) is a more intensive way to measure how the body handles a concentrated load of sugar. During this test, the patient consumes a standardized 75 g glucose load. The clinician then measures the two-hour plasma glucose level following the ingestion of the glucose.
A result of ≥200 mg/dL (11.1 mmol/L) at the two-hour mark is diagnostic of diabetes. This method is particularly useful for identifying impaired glucose tolerance.
The Oral Glucose Tolerance Test (OGTT) is a medical procedure used to assess how the body metabolizes glucose. It involves fasting, consuming a glucose solution, and taking blood samples at specific intervals to measure glucose levels.
Random Plasma Glucose and Hyperglycemia Symptoms
The fourth diagnostic method is the random plasma glucose test. Unlike the previous three methods, this test does not require fasting or a specific timed glucose load. Instead, it is used when a patient presents with classic symptoms of hyperglycemia.
Recognizing Hyperglycemia
Hyperglycemia can manifest through several "classic" symptoms that often prompt a patient to seek medical attention:
Polyuria: Excessive urination.
Polydipsia: Excessive thirst.
Polyphagia: Excessive hunger.
Unexplained weight loss: Often seen in Type 1 diabetes.
If a patient presents with these classic symptoms or is experiencing a hyperglycemic crisis (such as Diabetic Ketoacidosis or HHS), a random plasma glucose level of ≥200 mg/dL (11.1 mmol/L) is considered diagnostic.
Clinical Pearl: In cases of hyperglycemic crisis or clear symptomatic hyperglycemia accompanied by a high random glucose level, repeat testing is not required.
Summary of Diagnostic Criteria
When navigating these tests, it is important to follow standardized clinical protocols to ensure accuracy and patient safety.
Method
Requirement
Diagnostic Threshold
Confirmation Needed?
HbA1C
None (Non-fasting)
≥6.5%
Yes
FPG
Fasting ≥8 hours
≥126 mg/dL
Yes
OGTT
75 g glucose load
≥200 mg/dL (at 2 hrs)
Yes
Random Glucose
None (Symptomatic)
≥200 mg/dL
No (if symptomatic)
For the first three methods, if a result is elevated, it must be confirmed by repeat testing to rule out laboratory error. It is medically preferable to use the same test for the repeat confirmation as was used during the initial assessment.
This diagram illustrates four common methods for diagnosing diabetes: Fasting Plasma Glucose (FPG), Oral Glucose Tolerance Test (OGTT), Glycosylated Hemoglobin (A1C), and Random Plasma Glucose (RPG), along with their respective requirements, diagnostic values, and what each test indicates.
Keep reading for free.
Create an account to finish this reading and make it part of your study routine.