Explains the concept of supply in economics, including the supply curve, quantity supplied, and the factors that cause shifts in supply, such as input prices, technology, and expectations.
In economic theory, understanding how much of a good or service producers are willing to bring to market is fundamental to analyzing how prices are set and how resources are allocated. This concept is encapsulated in the study of supply. While we often think of supply as a simple number, it is actually a relationship between various factors that dictate how much a seller is willing and able to offer at every possible price.
The Supply Curve and Quantity Supplied
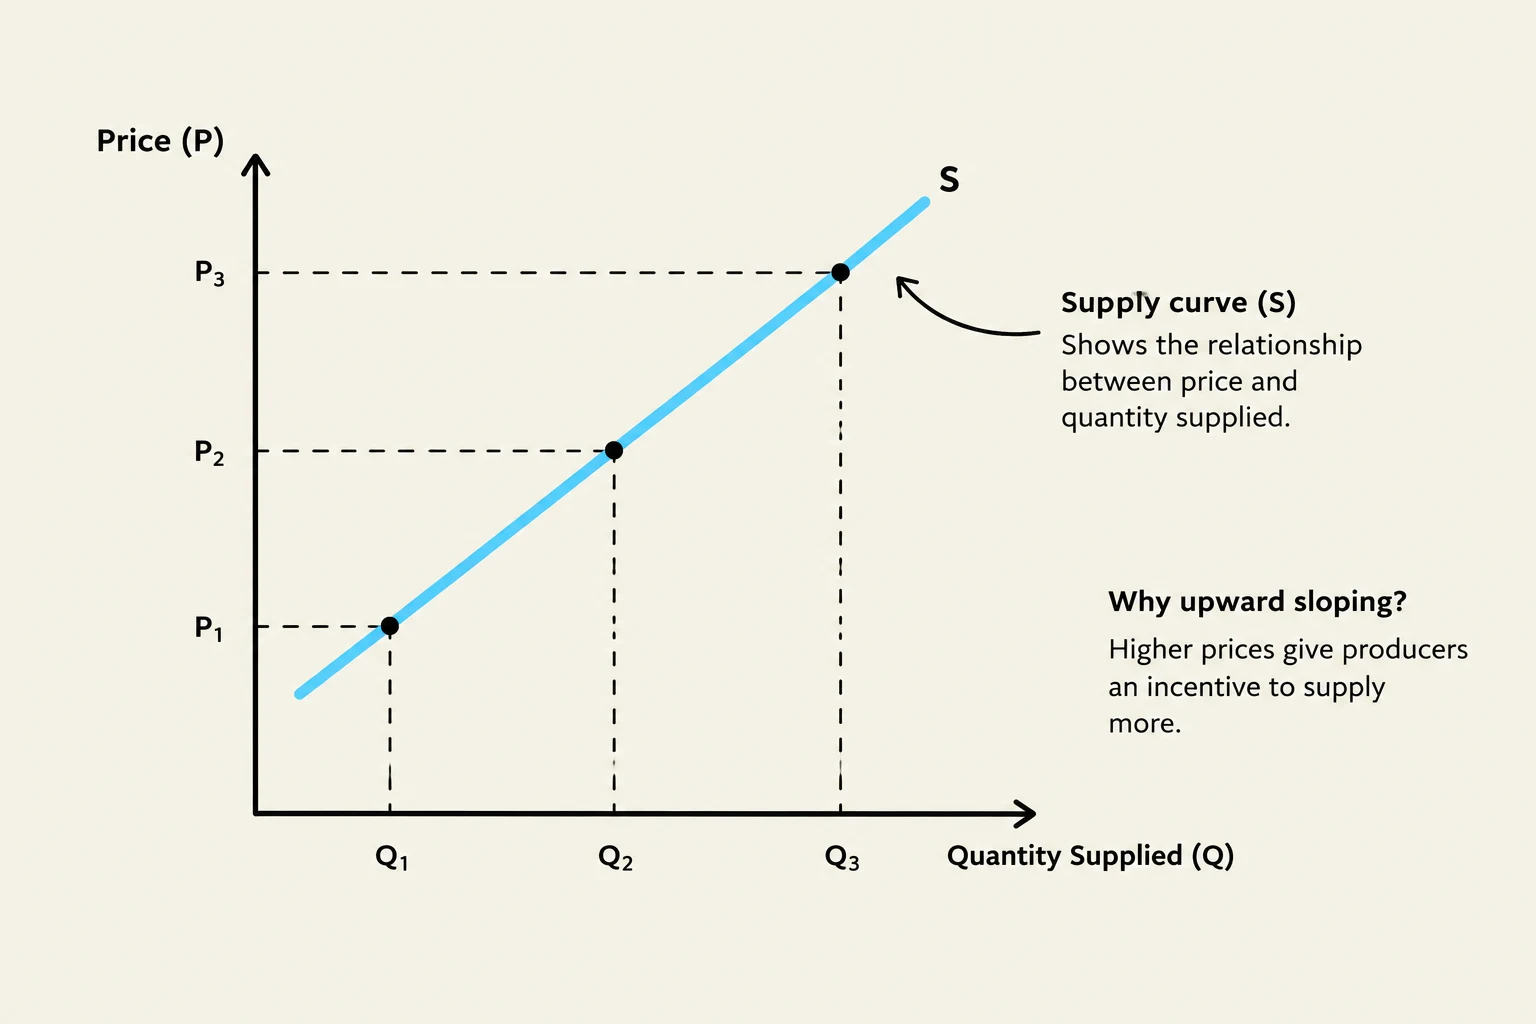
The supply curve is a graphical representation of the relationship between the price of a good and the quantity that sellers are willing to provide. According to the Law of Supply, all else being equal (ceteris paribus), the quantity supplied rises as the price rises. This results in an upward-sloping curve.
To understand why this curve slopes upward, we must look at the "Rational Rule for Sellers" in competitive markets: a seller should sell until their marginal benefit equals their marginal cost. In a competitive market, the marginal benefit is essentially the market price. Because of diminishing marginal product—where adding more of a variable input (like labor) to a fixed input (like machinery) eventually leads to smaller increases in output—the marginal cost of producing extra units tends to rise. Therefore, to cover these rising costs, sellers require a higher price to justify producing more, which creates the upward slope.
Crucial Distinction: Do not confuse "supply" with "quantity supplied." Supply refers to the entire relationship (the whole curve), while quantity supplied refers to a specific amount offered at a specific price (a single point on the curve).
This graph illustrates the supply curve (S), demonstrating the positive relationship between price (P) and quantity supplied (Q). It explains that higher prices incentivize producers to supply more.
Movement Along the Curve
A change in the price of the good itself does not shift the supply curve; instead, it causes a movement along the existing curve. If the price of a product increases, the quantity supplied increases. If the price decreases, the quantity supplied decreases.
Determinants of Supply: Shifting the Curve
A shift of the supply curve occurs when a factor other than the good's own price changes. A shift to the right represents an increase in supply (more is offered at every price), while a shift to the left represents a decrease in supply (less is offered at every price).
Several key determinants drive these shifts:
1. Prices of Inputs
Input prices are the costs of the resources used to produce a good (e.g., labor, raw materials, energy).
Increase in Supply: If the price of an input decreases, production becomes cheaper, shifting the curve to the right.
Decrease in Supply: If input prices rise, the cost of production increases, shifting the curve to the left.
2. Prices of Related Outputs
Producers often have choices regarding what to produce. This leads to the concepts of substitutes and complements in production.
Substitutes in Production: These are goods that can be produced using the same resources. For example, a farmer can plant either corn or soybeans. If the price of corn rises, the farmer will likely switch resources to corn, which causes the supply of soybeans to decrease (a left shift).
Complements in Production: These are goods produced together from the same process. If the price of a complement rises, it incentivizes more production of the primary good, increasing its supply.
This graph illustrates an increase in supply, showing how the supply curve shifts to the right, indicating that more of a good is supplied at every price.
3. Technology and Productivity
Improvements in technology or increases in productivity allow firms to produce more output with the same amount of inputs. This lowers the marginal cost of production, causing the supply curve to shift to the right. Conversely, a decrease in productivity or outdated technology would shift the curve to the left.
4. Number of Sellers
The market supply is the horizontal sum of all individual supplies.
Increase in Supply: When new firms enter a market, the total number of sellers increases, shifting the market supply curve to the right.
Decrease in Supply: When firms exit the market, the supply curve shifts to the left.
5. Expectations
Sellers' expectations about the future can influence current supply.
Optimism: If sellers expect prices to rise significantly in the future, they might withhold some supply now to sell later, or if they expect higher demand, they may prepare for expansion.
Pessimism: If sellers expect a market downturn or lower future prices, they may attempt to sell more of their inventory immediately, affecting current supply dynamics.
Summary Table of Supply Shifts
Factor
Change
Shift Direction
Input Prices
Decrease
Right (Increase)
Input Prices
Increase
Left (Decrease)
Technology
Improvement
Right (Increase)
Number of Sellers
Entry of new firms
Right (Increase)
Price of Substitutes in Production
Increase
Left (Decrease)
Price of Complements in Production
Increase
Right (Increase)
Conclusion
Understanding the dynamics of supply requires a clear distinction between price-driven movements and factor-driven shifts. While the price of a good determines the quantity supplied, the underlying determinants—inputs, technology, related goods, number of sellers, and expectations—determine the overall supply available to the market. These dynamics create the fundamental parallels between the behavior of buyers (demand) and sellers (supply) in economic theory.
Keep reading for free.
Create an account to finish this reading and make it part of your study routine.