Describing Hearing Loss: Degree, Configuration, and Frequency Ranges
Learn how to interpret pure tone audiometry results by understanding the degree, configuration, and frequency ranges of hearing loss, and how these elements are combined for a comprehensive clinical description.
When a clinician performs a pure tone audiometry test, the goal is to determine the patient's hearing thresholds—the lowest intensity at which they can perceive a sound 50% of the time. Once these thresholds are plotted on an audiogram, the clinician must translate those visual patterns into a professional clinical description. This description is not just a random collection of observations; it follows a specific logical structure involving the degree, the configuration, and often the frequency range of the hearing loss.
Understanding the Degree of Hearing Loss
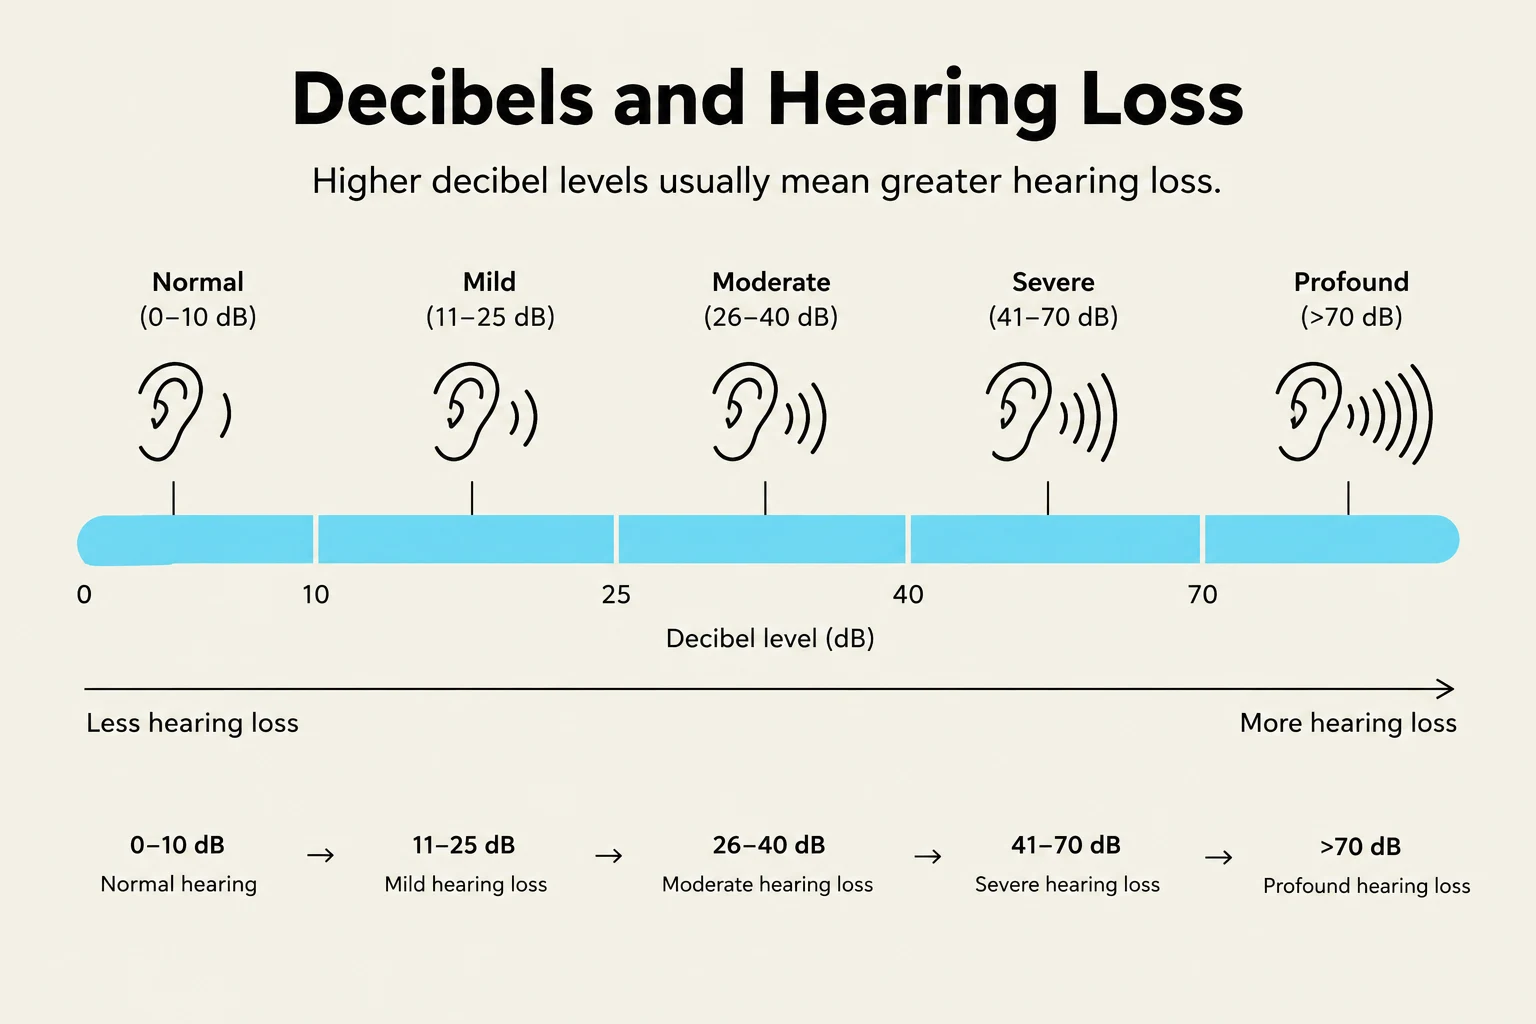
The "degree" of hearing loss refers to how significant the loss is. It is determined by looking at where the thresholds fall on the decibel (dB) scale of the audiogram. While thresholds can vary at each frequency, we use specific categories to classify the severity.
For adults, normal hearing is generally considered to be within the 0–25 dB range. As the decibel level required for detection increases, the degree of loss becomes more severe.
Commonly used classifications include:
Normal Hearing: 0–10 dB
Mild Hearing Loss: 30–40 dB
Severe Hearing Loss: 75–90 dB
Exam Tip: In pediatric populations, "normal" hearing is often defined up to 25 dB, whereas for adults, thresholds closer to 0–10 dB are typically considered the standard for normal.
This chart illustrates the relationship between decibel levels and the severity of hearing loss, ranging from normal hearing to profound hearing loss.
Describing the Configuration
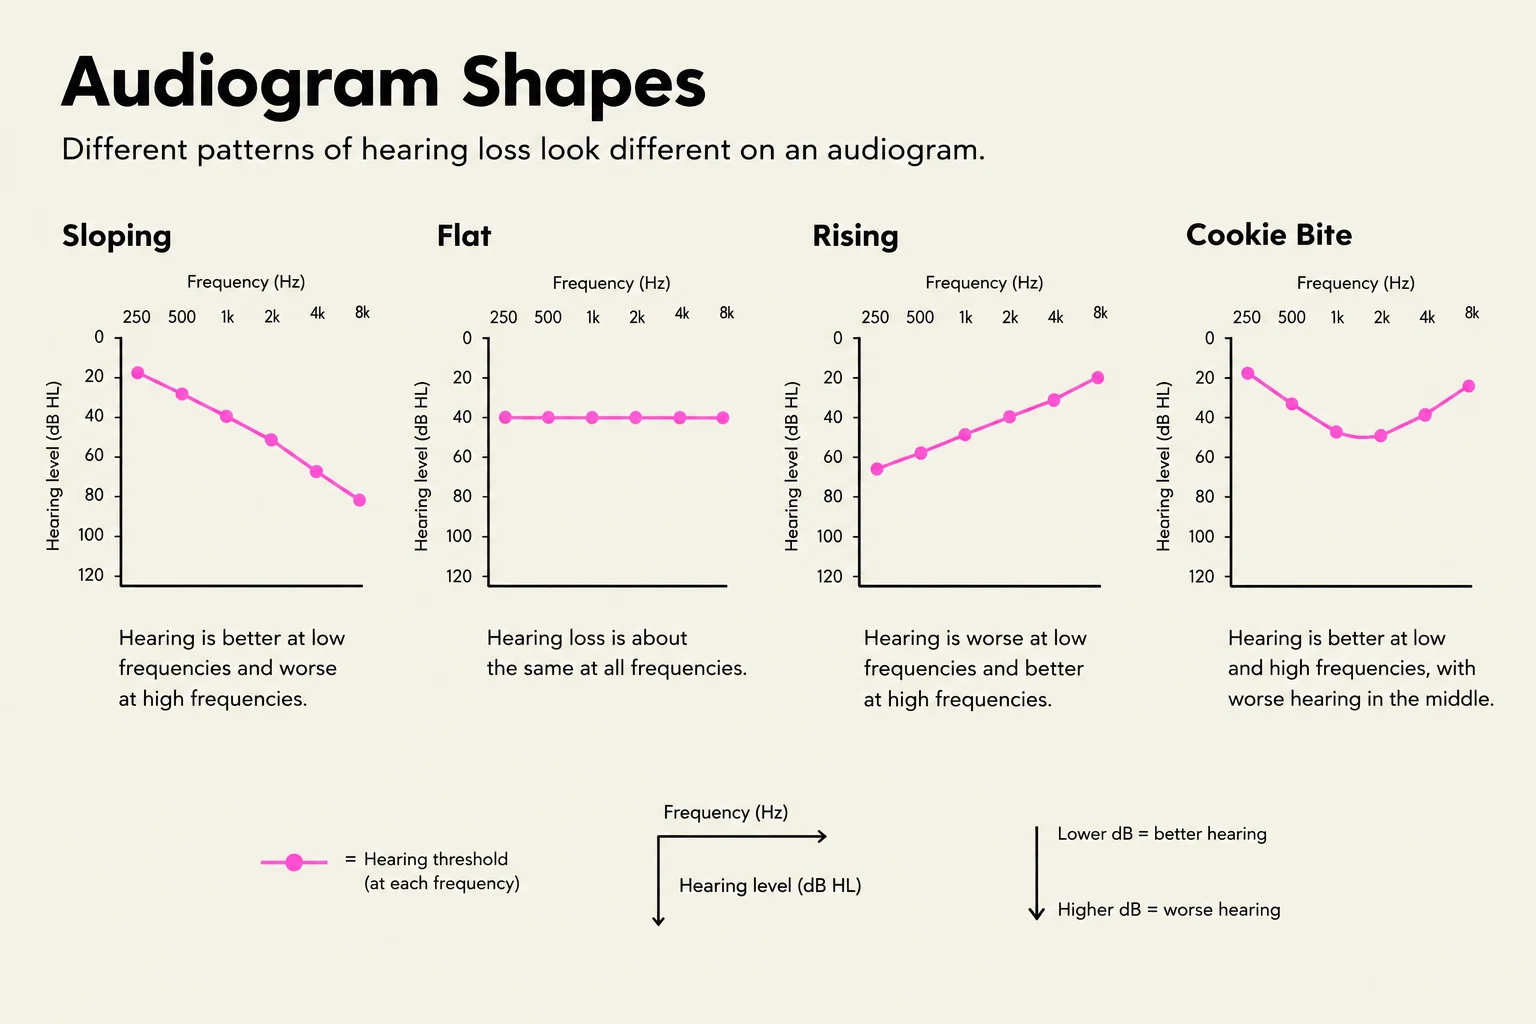
While the degree tells us how much a patient is missing, the configuration describes how the hearing loss looks across the frequency spectrum (from 250 Hz to 8000 Hz). The configuration is the "shape" of the audiogram line.
There are several standard configurations used in clinical practice:
Sloping: The thresholds are better (lower dB) at low frequencies and become progressively worse (higher dB) at high frequencies.
Precipitously Sloping: A variation of sloping where the drop-off in hearing sensitivity is extremely sharp and sudden.
Flat: The hearing loss is relatively consistent across all tested frequencies.
Rising: The thresholds are worse at low frequencies and improve (become lower dB) as the frequency increases.
Cookie Bite: A pattern where hearing is relatively normal in the low and high frequencies but shows a dip (worse thresholds) in the mid-frequencies.
Reverse Cookie Bite: The opposite of cookie bite; hearing is better in the mid-frequencies but worse at the low and high extremes.
Noise Notch: A specific dip in hearing thresholds, often associated with noise exposure, typically occurring at specific frequencies.
This image displays four types of audiogram shapes: Sloping, Flat, Rising, and Cookie Bite, illustrating different patterns of hearing loss based on frequency and hearing level.
Combining Degree and Configuration
To provide a complete clinical picture, clinicians use a standard "equation" to combine these findings. For a basic hearing loss that maintains a consistent pattern, the formula is:
Degree, configuration, (to) degree
For example, if a patient has thresholds starting at 30 dB (mild) and ending at 50 dB (moderate) with a downward trend, you would describe it as:
"Mild sloping (to) moderate".
Handling Complex Patterns with Frequency Ranges
In many clinical cases, the hearing loss is not uniform. A patient's thresholds might start in one degree and configuration, then shift into another as the frequency changes. When this happens, we must segment the audiogram by frequency range (e.g., 250–1000 Hz) to be precise.
The expanded equation for complex cases is:
Degree, configuration, (to) degree, frequencies
Worked Example 1: Segmented Description
Imagine a patient with the following profile:
Segment 1: From 250 Hz to 1000 Hz, thresholds are around 35 dB (Mild) and the pattern is increasing (Rising).
Segment 2: From 2000 Hz to 8000 Hz, thresholds are around 60 dB (Moderate) and the pattern is decreasing (Sloping).
To describe this, you combine the segments:
"Moderate rising to mild 250–1000 Hz, sloping to severe 2000–8000 Hz".
Worked Example 2: Precise Transitions
If a patient's thresholds are:
250–1500 Hz: 20/25 dB to 35/40 dB (Normal to Mild, Rising)
2000–8000 Hz: 80 dB to 90 dB (Severe, Precipitously Sloping)
The clinical description would be:
"Normal rising to mild 250–1500 Hz, followed by mild precipitously sloping to severe 2000–8000 Hz".
Clinical Rule of Thumb: When the audiometric pattern changes across the spectrum, always break the description into segments defined by specific frequency ranges. This ensures the most accurate "picture" of the patient's hearing is communicated to other professionals.
Summary of Clinical Identification
A complete audiological description typically integrates three key components: Degree, Configuration, and Type (Conductive, Sensorineural, or Mixed).
The most comprehensive way to report a finding is:
Degree, configuration, (to) degree, type, frequencies
For example: "Mild sloping to moderate sensorineural hearing loss, 250–8000 Hz".
Keep reading for free.
Create an account to finish this reading and make it part of your study routine.