


In the modern business landscape, data is the foundation of every strategic decision. Whether a company is analyzing customer satisfaction or predicting future sales, the quality of the decision depends entirely on the quality of the data collected. This article explores the fundamental concepts of data collection, the distinction between populations and samples, various sampling techniques, and the levels of measurement used to categorize information.
Understanding the Data Landscape
Before diving into collection methods, it is essential to distinguish between two closely related fields: Business Statistics and Business Analytics.
Business Statistics refers to the procedures used to collect, organize, analyze, and interpret data to provide meaningful information. This involves steps such as collecting data through surveys, organizing it into tables, and analyzing it using tools like the mean or standard deviation.
Business Analytics takes these statistical methods a step further by using data, models, and technology to support and improve business decision-making. While statistics provides the "what" (the analysis), analytics provides the "how" (using tools like Excel, Python, or Tableau to drive insights).
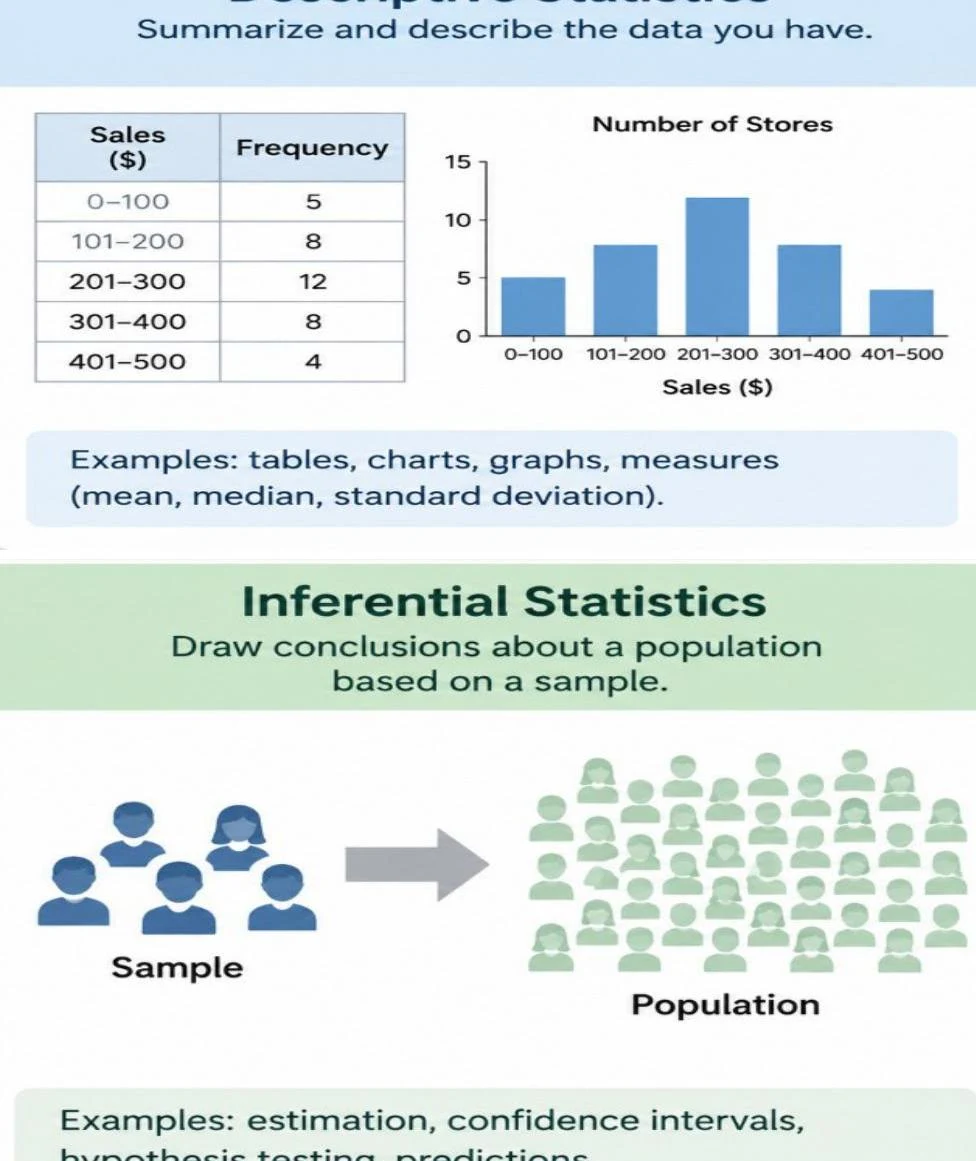
Within this field, we often distinguish between two types of statistics:
- Descriptive Statistics: These summarize and describe the data you currently have, such as through tables, charts, or measures like the median.
- Inferential Statistics: These allow you to draw conclusions about a large group based on a smaller subset.
Population vs. Sample: The Core Distinction
Imagine a company with 20,000 customers that wants to measure satisfaction. Does the company need to ask every single person? Usually, the answer is no. This is where the distinction between a population and a sample becomes vital.
Keep reading for free.
Create an account to finish this reading and make it part of your study routine.
Continue reading freeAlready have an account? Log in
Updated