Data Classification and Summarizing Categorical Variables
This article explains how to classify data into categorical and numerical types and provides a guide on how to effectively summarize a single categorical variable using frequency tables, proportions, percentages, and the mode. It also covers graphical representations like pie charts and bar charts.
In the field of statistics, the ability to transform raw data into meaningful information is essential for evidence-based decision-making. Before we can apply complex mathematical models, we must first understand the nature of the data we are handling. This process begins with data literacy: recognizing the types of variables present in a dataset and understanding how to summarize them appropriately. This article explores how to classify data into categorical and numerical types and provides a guide on how to effectively summarize a single categorical variable.
Data Classification: The Foundation of Analysis
Not all data is created equal. The mathematical operations you can perform on a dataset—such as calculating an average or finding a range—depend entirely on how the data is classified. Generally, variables are divided into two primary branches: Categorical and Numerical.
Categorical Variables
A categorical variable describes a quality or characteristic. An observation for a categorical variable can only belong to one of two or more distinct groups. These variables are often referred to as "measured" in a qualitative sense, as they categorize the subjects into named groups.
Categorical variables are further subdivided based on whether the groups have a natural order:
Nominal Variables: These are categorical variables with no inherent ordering. For example, if you are recording a person's favorite stock market share or their eye color, there is no mathematical way to say one category is "higher" or "greater" than another.
Ordinal Variables: These are categorical variables that possess a specific, logical ordering. A classic example is income groups, such as <$50K, $50–$100K, and >$100K. While you know that the third group represents more money than the first, the "distance" between these groups is not precisely defined.
Binary or Dichotomous Variables: When a categorical variable has exactly two possible outcomes, it is referred to as binary or dichotomous.
A binary variable can be nominal, such as the outcome of a coin toss (Heads or Tails).
A binary variable can be ordinal, such as an age grouping (e.g., <20 years vs. ≥20 years).
Numerical Variables
Numerical variables represent quantities. Unlike categorical variables, a numerical observation can take on any integer or non-integer value within a given range. These are often called "measured" variables because they represent a scale of measurement.
Numerical variables are classified into two types:
Discrete Variables: These variables take on distinct, separate values, usually integers. You cannot have half a student in a class or 2.5 shares owned; these counts jump from one whole number to the next.
Continuous Variables: These variables can assume any value within a certain range, including decimals and fractions. Common examples include weight (kg), income ($), and age (years).
Student Tip: The "Average" Trap
A common mistake is attempting to calculate the mean (average) of a categorical variable. For example, if you assign "1" to "Cat" and "2" to "Dog," calculating an average of 1.5 is mathematically possible but logically meaningless. You cannot be "halfway between a cat and a dog." Always check your variable type before choosing a summary statistic!
Summarising One Categorical Variable
Once you have identified a variable as categorical, you need a way to describe it to others. Because you cannot calculate a mean or median for categories, you must rely on counts, proportions, and the mode.
Frequency Tables
The most fundamental way to summarize a single categorical variable is to construct a frequency table. A professional frequency table should include:
The name of the variable being studied.
The name of each distinct category.
The count (the number of observations in each category).
The proportion or percentage of observations in each category.
The total sample size, denoted as n.
To calculate these values:
Proportion: Total Sample Size (n)Count of Category
Percentage: Proportion×100
The Mode
The mode is the simplest measure of central tendency for categorical data. It is defined as the most common observation that appears in your dataset.
If your data consists of words:
(Cat, Dog, Snake, Cat, Dog, Dog, Snake)
The category "Dog" appears three times, while "Cat" and "Snake" appear only twice. Therefore, "Dog" is the mode.
If your data is coded numerically (where numbers represent categories):
(1, 2, 3, 1, 2, 2, 3)
Here, if 1=Cat, 2=Dog, and 3=Snake, the number 2 is the mode because it occurs most frequently.
Graphical Representations
Visualizing categorical data allows for quick identification of patterns and distributions. Two primary methods are used:
Pie Charts
A pie chart represents the distribution of categories as slices of a circle, where the size of each slice corresponds to the percentage of the total. This is particularly useful for showing how a whole is divided into various parts.
A pie chart showing the distribution of percentages across different categories.Figure 1: Distribution of occupational categories (Source 1, p.22).
Bar Charts
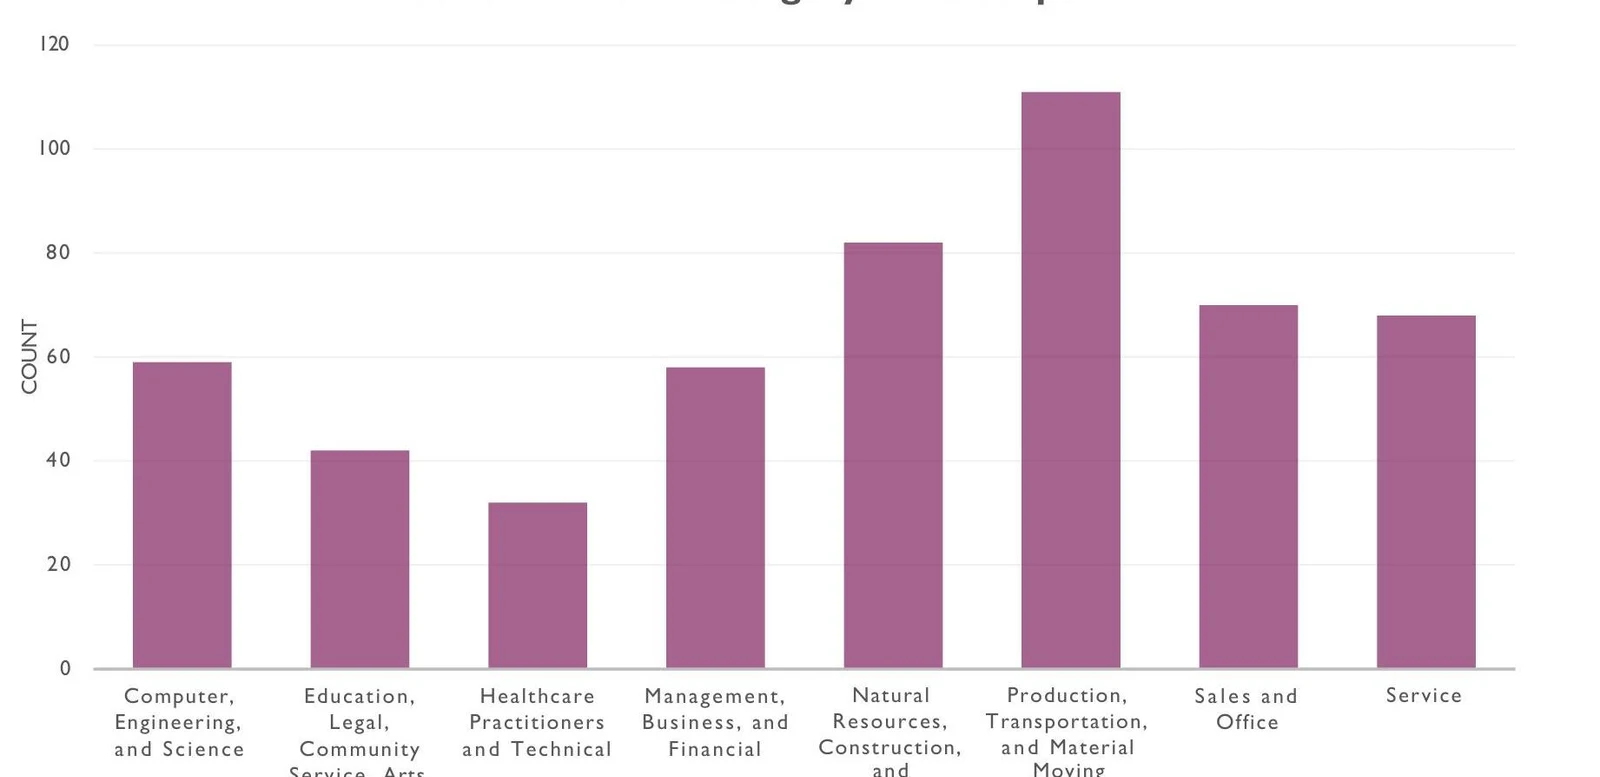
A bar chart uses rectangular bars to represent the counts (or frequencies) of each category. The height of each bar corresponds to the frequency of that specific category, making it easy to compare the relative sizes of different groups at a glance.
A bar chart showing the count of individuals in various employment sectors, including Computer, Engineering, and Science; Education, Legal, Community Service, and Arts; Healthcare Practitioners and Technical; Management, Business, and Financial; Natural Resources, Construction, and Production, Transportation, and Material Moving; Sales and Office; and Service.Figure 2: Count of broad occupational categories (Source 1, p.23).
Exam Tip: Pie Chart vs. Bar Chart
Use a pie chart when you want to emphasize how much each category contributes to a "whole" (e.g., market share). Use a bar chart when you want to compare the absolute sizes of different categories or when you have many categories that would make a pie chart look cluttered and unreadable.
Summary Table of Variable Types
Variable Type
Sub-type
Description
Example
Categorical
Nominal
Named groups, no order
Eye color, Gender
Ordinal
Named groups, logical order
Income brackets, Satisfaction levels
Binary/Dichotomous
Exactly two groups
Yes/No, Pass/Fail
Numerical
Discrete
Countable, integer values
Number of children, number of cars
Continuous
Measurable, any value in a range
Height, Temperature, Weight
By mastering these classifications and summary techniques, you ensure that your statistical analysis is both mathematically sound and communicable to your audience.
Keep reading for free.
Create an account to finish this reading and make it part of your study routine.