Controlling for Confounding Variables in Regression
This content explains how to interpret regression coefficients, slopes, and intercepts when analyzing the effect of an independent variable on a dependent variable while controlling for a confounder. It covers the building blocks of linear regression, evaluating the strength of effects using t-values, p-values, and con
In social science research, we often want to know if one variable causes a change in another. For example, does watching the news lead to higher political participation? However, the relationship between an independent variable (X) and a dependent variable (Y) is rarely isolated. Often, a third variable—a confounder (Z)—is associated with both X and Y, potentially distorting the true relationship. To get an accurate picture, researchers use a linear regression model to "control" for these confounders, allowing them to estimate the effect of X on Y while holding Z constant.
The Building Blocks of Linear Regression
Before we can control for anything, we must understand the components of a standard linear regression model. A regression model attempts to predict the value of a dependent variable based on one or more independent variables.
The mathematical formula for a simple linear regression is:
Y=a+b⋅X
Where:
Y (Dependent Variable): The outcome you are trying to predict or explain.
a (Intercept): The predicted value of Y when all independent variables (X) are equal to zero.
b (Slope/Regression Coefficient): This represents the effect of the independent variable. Specifically, it tells us how much the predicted value of Y changes for every one-unit increase in X.
X (Independent Variable): The predictor or the variable you believe influences Y.
A scatter plot illustrating a linear regression with labeled axes, data points, intercept, and regression line.
Evaluating the Strength of the Effect
When looking at a regression output (such as a table from R), you will see several key statistics used to determine if your results are meaningful:
t-value: This indicates how much evidence there is that a regression coefficient is different from zero. A large t-value suggests strong evidence of an effect, while a t-value close to zero suggests little to no effect.
p-value: This tells you the statistical significance of the coefficient. Typically, if p<.05, the relationship is considered statistically significant.
Confidence Interval: This provides a range of values within which the true population coefficient is likely to fall. If the interval does not include zero, the effect is considered statistically significant.
Standardised Regression Coefficients (β): These are used to compare the relative strength of different predictors within the same model, as they are measured in standard deviation units.
Understanding Confounding
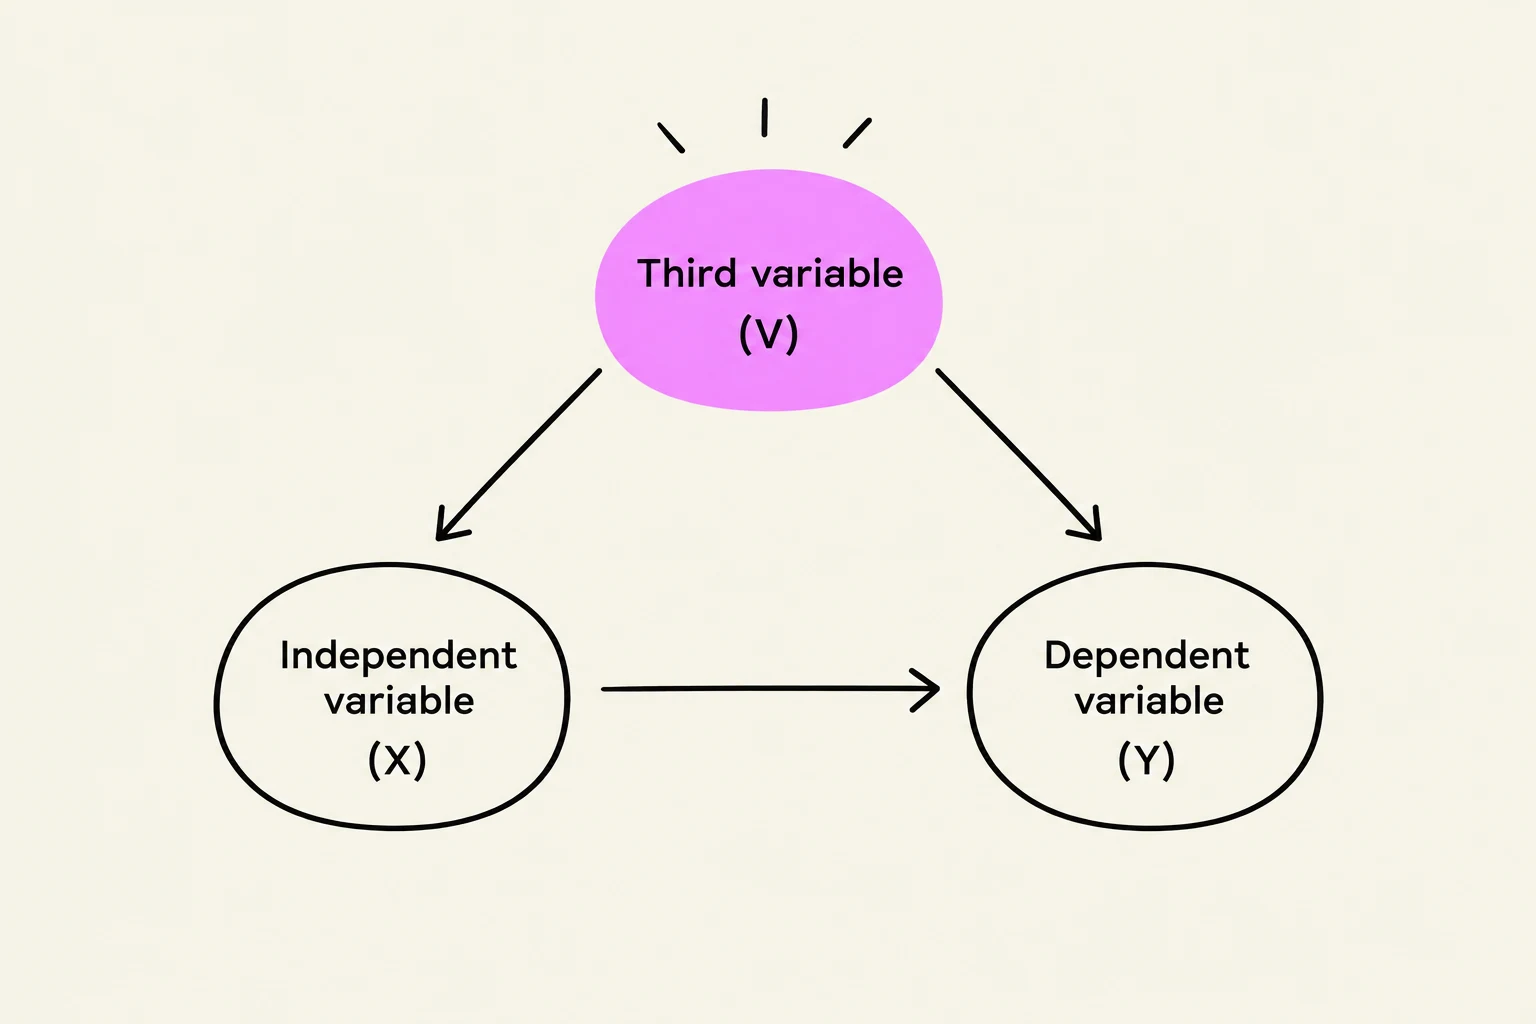
A confounder is a variable that is associated with both the independent variable and the dependent variable. If you do not include a confounder in your model, the relationship you observe between X and Y might be "spurious"—meaning it isn't a direct relationship, but rather a byproduct of the confounder's influence.
Example Scenario:
Imagine we study the effect of News Exposure (X) on Political Participation (Y). We might find a strong positive relationship. However, Political Interest (Z) might be a confounder: people with high political interest tend to watch more news and tend to participate more in politics.
A diagram illustrating the relationship between an independent variable (X), a dependent variable (Y), and a third variable (V) that influences both.
Controlling for Confounders: Four Possible Outcomes
When you run a second regression model that includes the confounder (e.g., Y predicted by X and Z), the regression coefficient for X will change. By comparing the first model (without Z) to the second model (with Z), you can identify one of four outcomes:
The effect disappears: The coefficient for X drops toward zero and becomes non-significant (p>.05). This means the original relationship was entirely explained by the confounder (a spurious relationship).
The effect becomes smaller: The coefficient for X decreases but remains significant. This is called partial confounding, meaning Z explains part of the relationship, but X still has its own unique effect.
The effect remains unchanged: The coefficient for X stays roughly the same. This suggests the confounder does not explain the relationship between X and Y.
The effect becomes stronger or changes direction: This is known as suppression or negative confounding. The confounder was actually "masking" the true relationship, making it appear weaker or even opposite in direction than it actually is.
Worked Example: Interpreting the Model
Let's apply this to our news exposure example. Suppose we run a model where Political Participation is predicted by News Exposure and Political Interest.
The Regression Equation:
Political Participation=.55+.34⋅News Exposure+.62⋅Political Interest
How to interpret these values:
Intercept (.55): The predicted score for political participation is .55 when both news exposure and political interest are zero.
Slope for News Exposure (.34): If news exposure increases by 1 unit, political participation is predicted to increase by .34 units, while controlling for political interest.
Slope for Political Interest (.62): If political interest increases by 1 unit, political participation is predicted to increase by .62 units, while controlling for news exposure.
Exam Tip: Calculating Predicted Scores
If an exam asks you to predict the score for someone with a News Exposure of 7 and Political Interest of 7, plug the numbers directly into the equation:
YYY=.55+(.34⋅7)+(.62⋅7)=.55+2.38+4.34=7.27
Always use the maximum number of decimal places provided in your output to ensure accuracy.
Final Check: Homoscedasticity
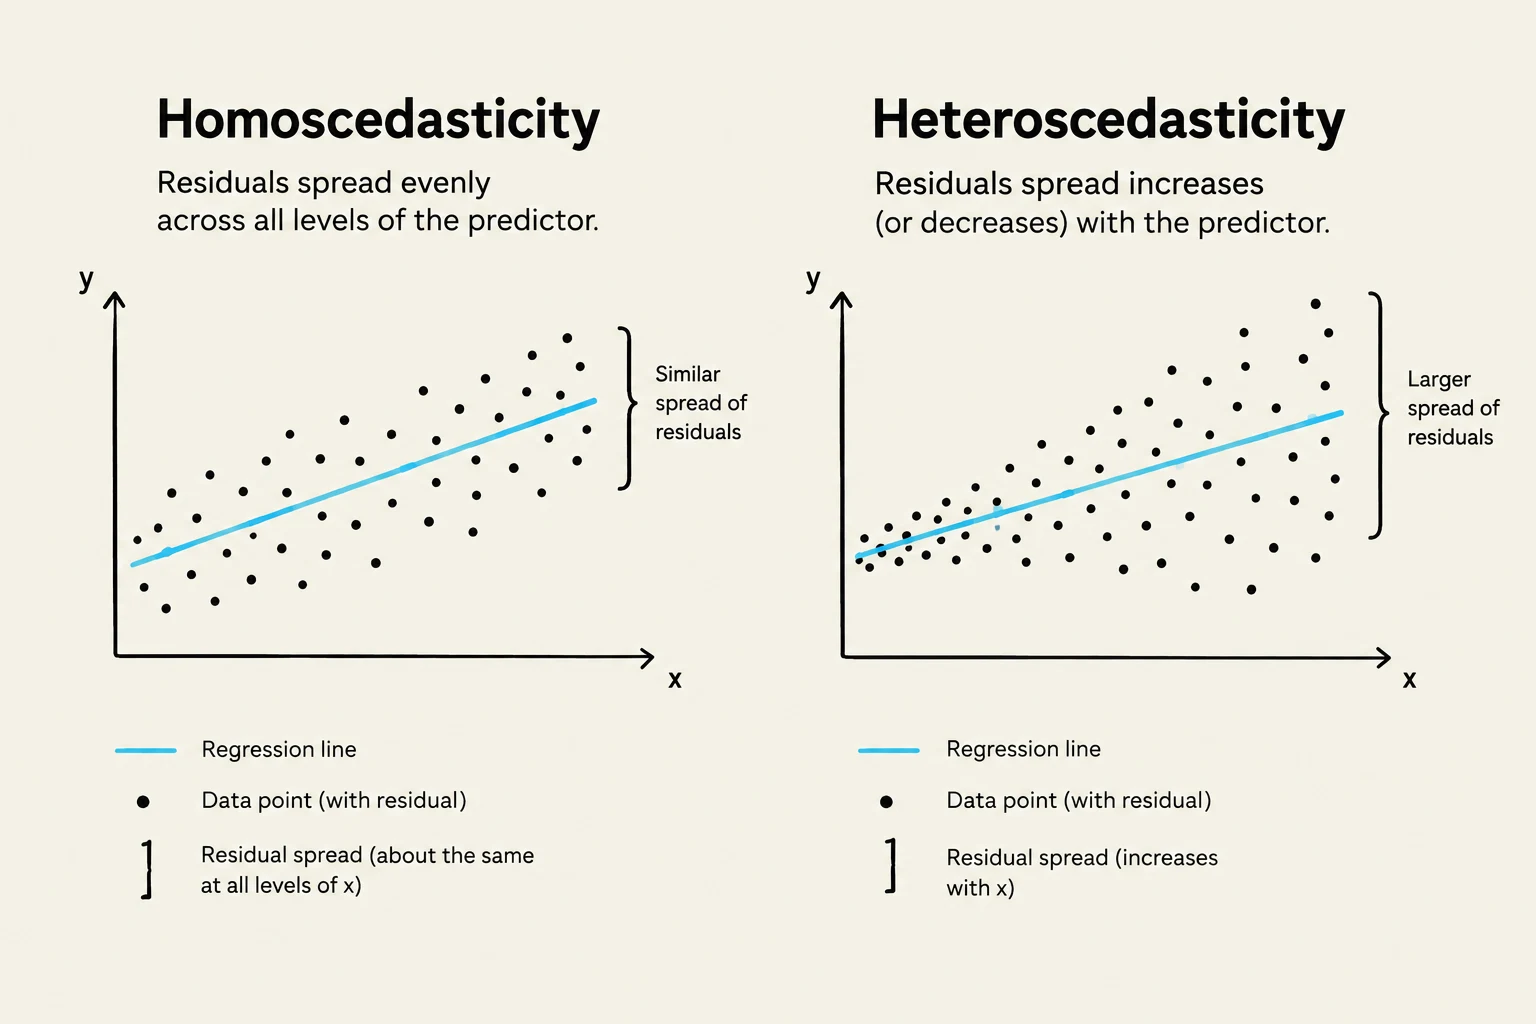
After running your regression, you must ensure the model's assumptions are met. One critical assumption is homoscedasticity. This means that the "residuals" (the errors or the differences between predicted and actual values) should be approximately equally spread around the regression line.
If the spread of errors increases or decreases as your predictor changes (creating a "funnel" shape), you have heteroscedasticity, and your model's reliability may be compromised.
This image illustrates homoscedasticity and heteroscedasticity, two concepts in statistics related to the spread of residuals in regression analysis. Homoscedasticity shows residuals spread evenly, while heteroscedasticity shows residuals increasing or decreasing with the predictor.
Keep reading for free.
Create an account to finish this reading and make it part of your study routine.