An overview of cardiac perfusion, including the cellular basis of heart function, electrical conduction, hemodynamics, common cardiovascular pathologies, and diagnostic/interventional procedures.
Perfusion is the vital process of delivering oxygen, fluids, and nutrients to the body's cells. To understand how this system fails during disease, we must first understand the intricate relationship between electrical signals and mechanical contraction within the heart.
The Cellular Foundation: Cardiac Myocytes
The heart is composed of specialized muscle cells known as cardiac myocytes. Unlike skeletal muscle, these cells possess unique properties that allow the heart to function as a continuous, coordinated pump:
Automaticity: The ability to spontaneously generate an electrical impulse.
Excitability: The ability to respond to an electrical impulse.
Conductivity: The ability to transmit an electrical impulse throughout the heart.
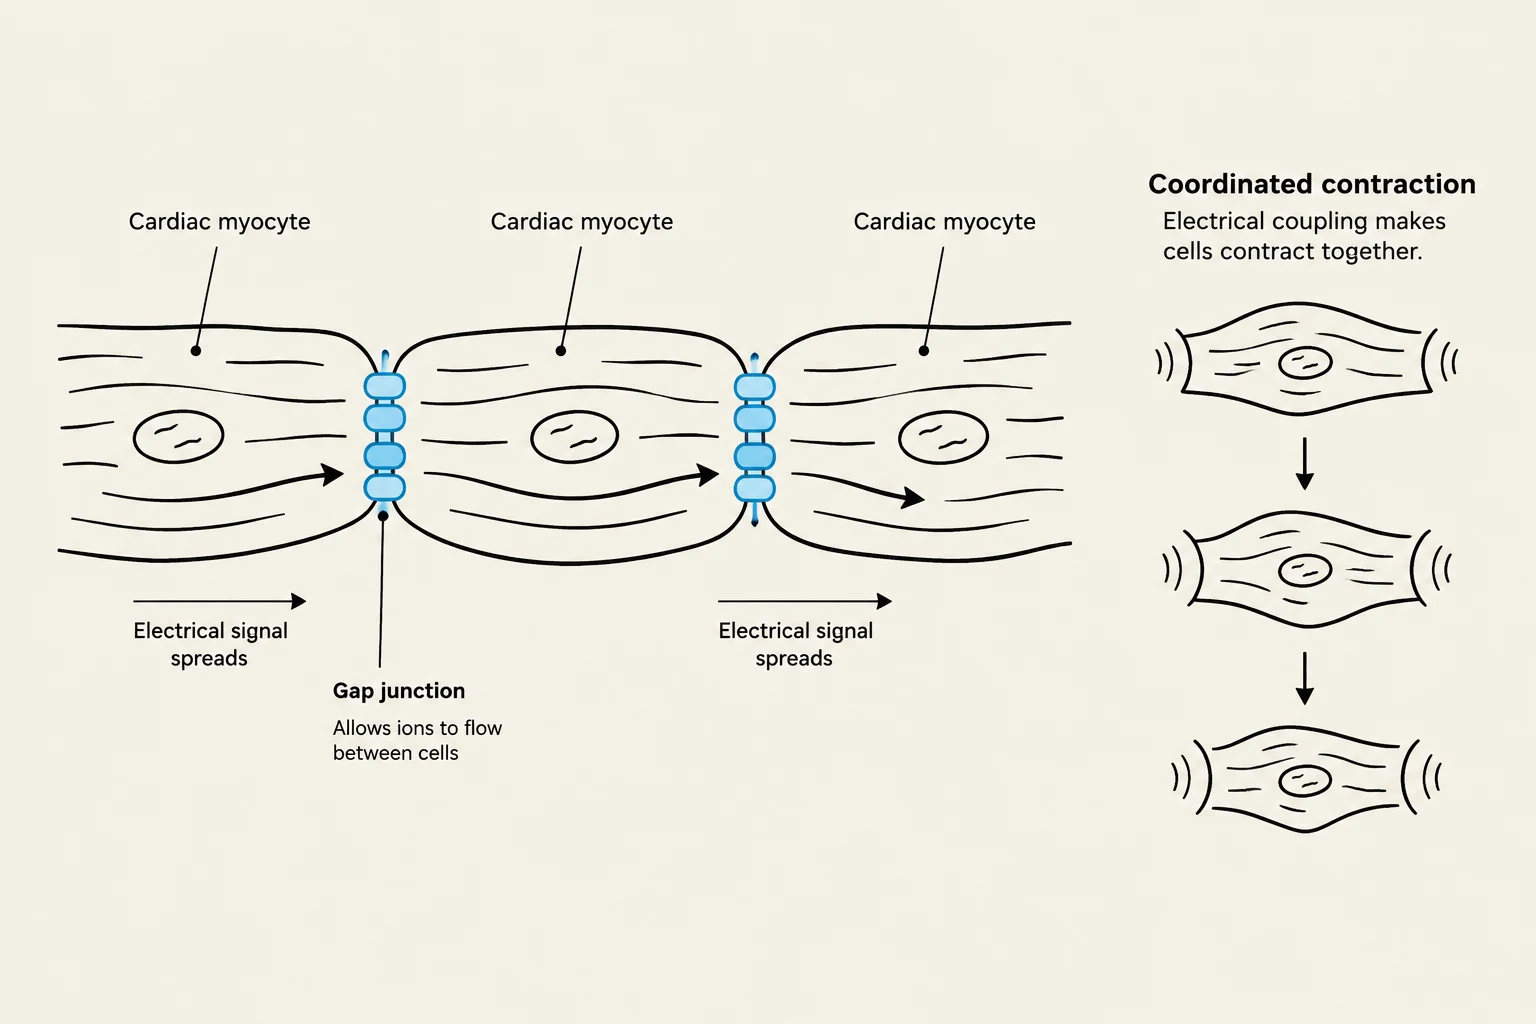
These myocytes are physically and electrically connected by gap junctions located within intercalated discs. These junctions allow for electrical coupling, meaning ions can flow directly from one cell to another, ensuring that the heart contracts as a single, functional unit rather than as isolated cells.
This diagram illustrates how cardiac myocytes are connected by gap junctions, allowing electrical signals to spread between them, leading to coordinated contraction of the heart muscle.
Electrical Conduction and the Action Potential
The heartbeat is driven by a specific conduction pathway that begins at the Sinoatrial (SA) node, the heart's natural pacemaker. The impulse travels through the atria, causing them to contract, and reaches the Atrioventricular (AV) node, which acts as a secondary controller before passing the signal to the ventricles.
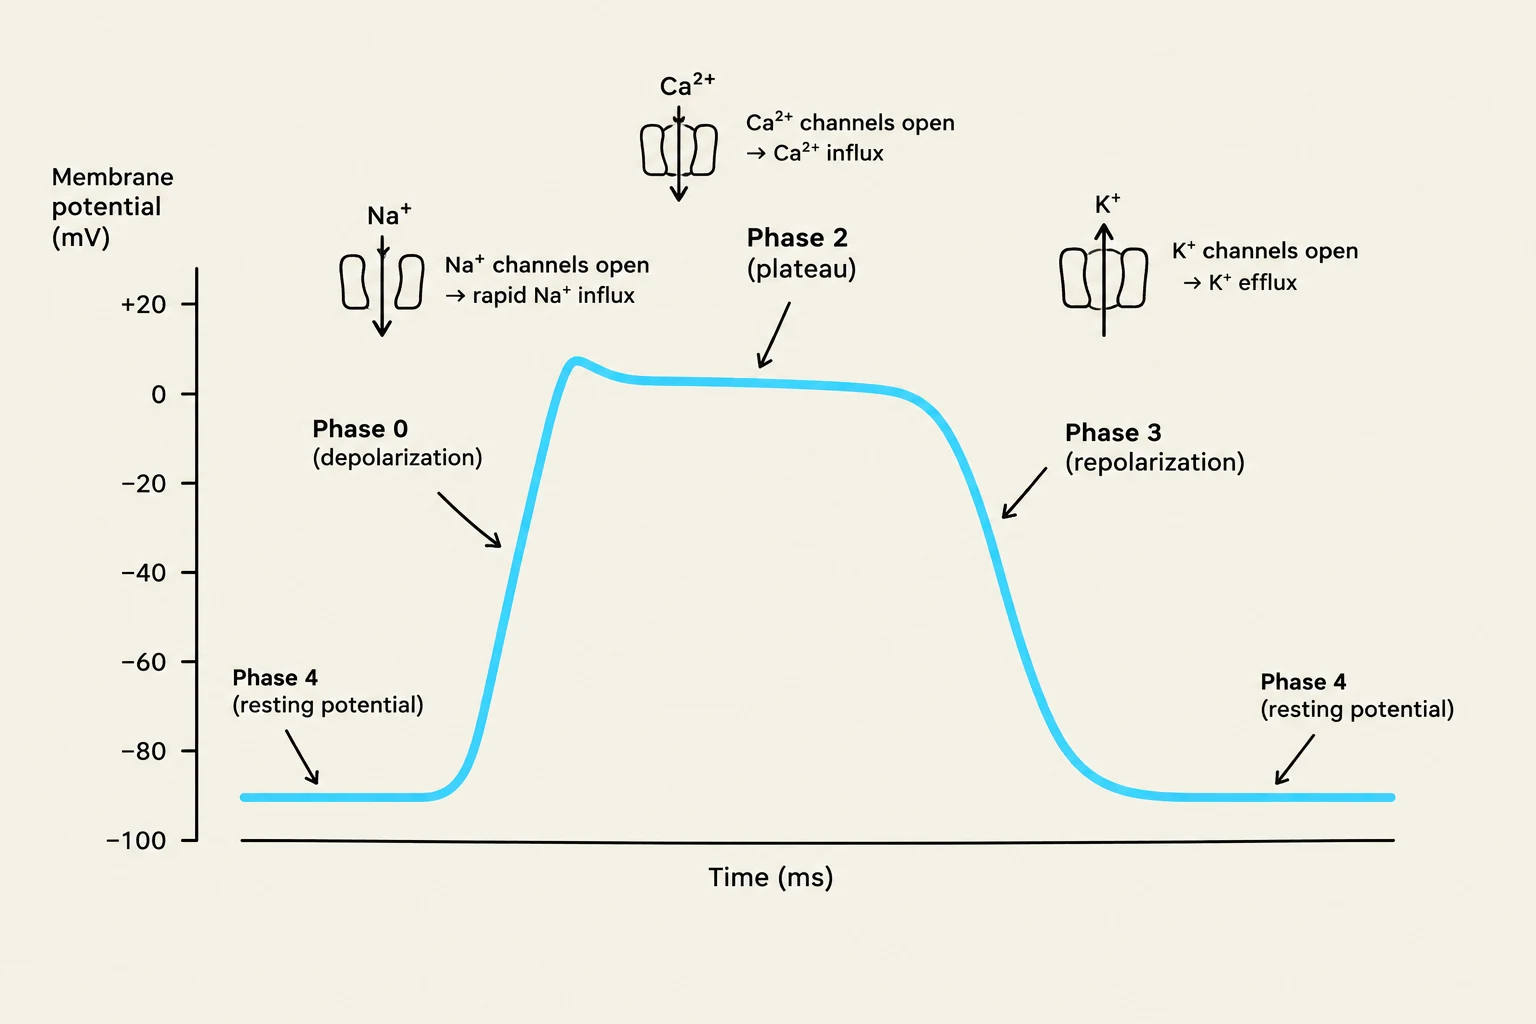
The movement of ions across the cell membrane creates the action potential—a brief reversal of electrical polarity. This process is governed by voltage-gated ion channels and the sodium-potassium pump, which maintains the resting membrane potential of approximately −90mV.
The Phases of the Action Potential
Pacemaker Cells: These cells use "funny currents" to allow sodium (Na+) to slowly enter the cell, gradually drifting the membrane toward the threshold.
Depolarization: Once the threshold (around −70mV) is reached, voltage-gated sodium channels open, and Na+ rushes into the cell, making it rapidly more positive.
The Plateau Phase: This is a unique feature of cardiac contraction. As sodium channels close, calcium (Ca2+) channels open. The entry of Ca2+ triggers calcium-induced calcium release from the sarcoplasmic reticulum, which initiates the actual muscle contraction.
Repolarization: To reset the cell, potassium ($K^+$) channels open and $K^+$ exits the cell, returning the membrane to its negative resting potential.
This graph illustrates the action potential of a cardiac myocyte, detailing the changes in membrane potential over time and the ion channel activity responsible for each phase: Phase 0 (depolarization), Phase 1 (not explicitly labeled but implied by the rapid drop after plateau), Phase 2 (plateau), Phase 3 (repolarization), and Phase 4 (resting potential).
Hemodynamics: Cardiac Output and Blood Pressure
The effectiveness of perfusion is measured by Cardiac Output (CO), which is the volume of blood ejected by the heart in one minute. It is calculated using the following formula:
CO=Stroke Volume (SV)×Heart Rate (HR)
Stroke Volume is the amount of blood pumped during a single contraction. It is influenced by three critical factors:
Preload: The volume of blood in the ventricles at the end of diastole (the "stretch").
Afterload: The resistance the left ventricle must overcome to eject blood into the systemic circulation.
Contractility: The intrinsic strength of the myocardial contraction.
Blood Pressure (BP) is the pressure exerted against the arterial walls. The body regulates BP through three main mechanisms:
Neural: The medulla oblongata in the brainstem uses baroreceptors to detect pressure changes and trigger the sympathetic nervous system to adjust heart rate and vascular tone.
Hormonal: The Renin-Angiotensin-Aldosterone System (RAAS) is a major regulator. Renin from the kidneys leads to the production of Angiotensin II (a potent vasoconstrictor) and Aldosterone (which retains salt and water). Additionally, Vasopressin (ADH) signals the kidneys to conserve water.
Vascular: The endothelium of blood vessels secretes both vasoconstrictors and vasodilators to maintain balance.
Clinical Pathologies and Complications
When these physiological mechanisms fail, several life-threatening conditions can arise.
Coronary Artery Disease and Myocardial Infarction
Coronary Artery Disease (CAD) occurs when plaque builds up in the arteries supplying the heart, reducing blood flow. This can manifest as angina (chest pain). Stable angina is predictable and relieved by rest, whereas unstable angina is unprovoked and represents an urgent situation. If blood flow is completely blocked, a Myocardial Infarction (MI) occurs, causing muscle injury.
Heart Failure
Heart failure occurs when the heart cannot pump enough blood to meet metabolic demands.
Left-sided Heart Failure: Blood backs up into the lungs, causing shortness of breath and pulmonary crackles.
Right-sided Heart Failure: Blood backs up into the systemic circulation, causing jugular vein distension (JVD) and peripheral edema (swelling in ankles/legs).
Arrhythmias and Shock
Arrhythmias are disturbances in the heart's electrical rate or rhythm. If the heart's ability to perfuse tissues fails entirely, the patient enters shock:
Hypovolemic: Due to low blood volume (e.g., bleeding).
Cardiogenic: Due to pump failure (e.g., a major MI).
Distributive: Due to massive vasodilation (e.g., sepsis).
Obstructive: Due to a physical blockage (e.g., pulmonary embolism).
Diagnostics and Interventions
Clinicians use several tools to assess cardiac health:
Labs:Troponin is a marker for heart muscle injury, and BNP indicates cardiac wall stretch (often seen in heart failure).
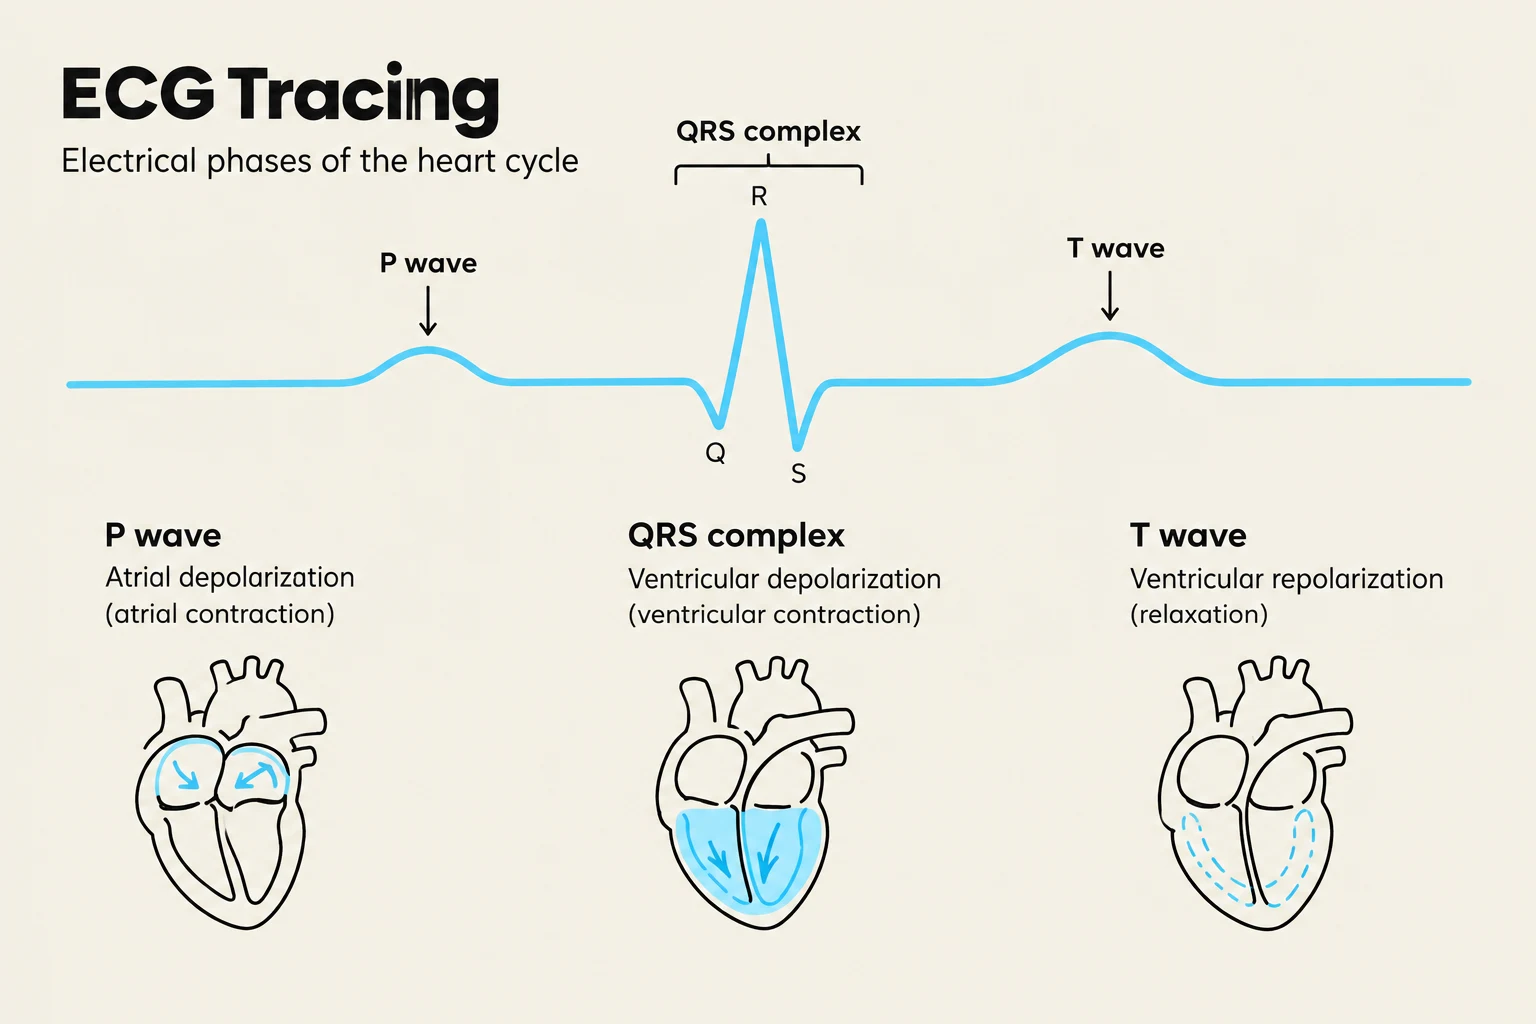
ECG (Electrocardiogram): Monitors electrical waves, including the P wave (atrial activation), QRS complex (ventricular activation), and T wave (ventricular recovery).
Imaging: Echocardiograms assess valve function and ejection fraction, while stress tests evaluate heart response to activity.
An electrocardiogram (ECG) tracing illustrates the electrical phases of the heart cycle, including the P wave (atrial depolarization), QRS complex (ventricular depolarization), and T wave (ventricular repolarization), with corresponding diagrams of the heart's electrical activity.
Common Procedures
Procedure
Description
Angioplasty
Using a balloon (and often a stent) to open a narrowed artery.
CABG
Coronary Artery Bypass Grafting; creating a new route for blood around a blockage.
Pacemaker
An implanted device that sends electrical impulses to prevent slow rhythms.
Cardioversion
Synchronized electrical shock to restore rhythm in unstable patients with a pulse.
Defibrillation
Unsynchronized shock used for pulseless rhythms like Ventricular Fibrillation.
Exam Tip: Remember that while Angioplasty and CABG treat the symptoms of Coronary Artery Disease, they do not "cure" the underlying disease process.
Keep reading for free.
Create an account to finish this reading and make it part of your study routine.