An in-depth explanation of cardiac output, cardiac index, preload, afterload, and the factors that regulate blood flow and myocardial contractility. This content also covers physiological laws and reflexes related to blood pressure regulation.
Understanding how the heart pumps blood and how that blood moves through the vascular system is fundamental to clinical practice. This process, known as hemodynamics, involves a complex interplay of pressure, resistance, and cardiac function. By mastering the relationships between cardiac output, preload, afterload, and contractility, you can better interpret vital signs and understand the pathophysiology of shock, heart failure, and hypertension.
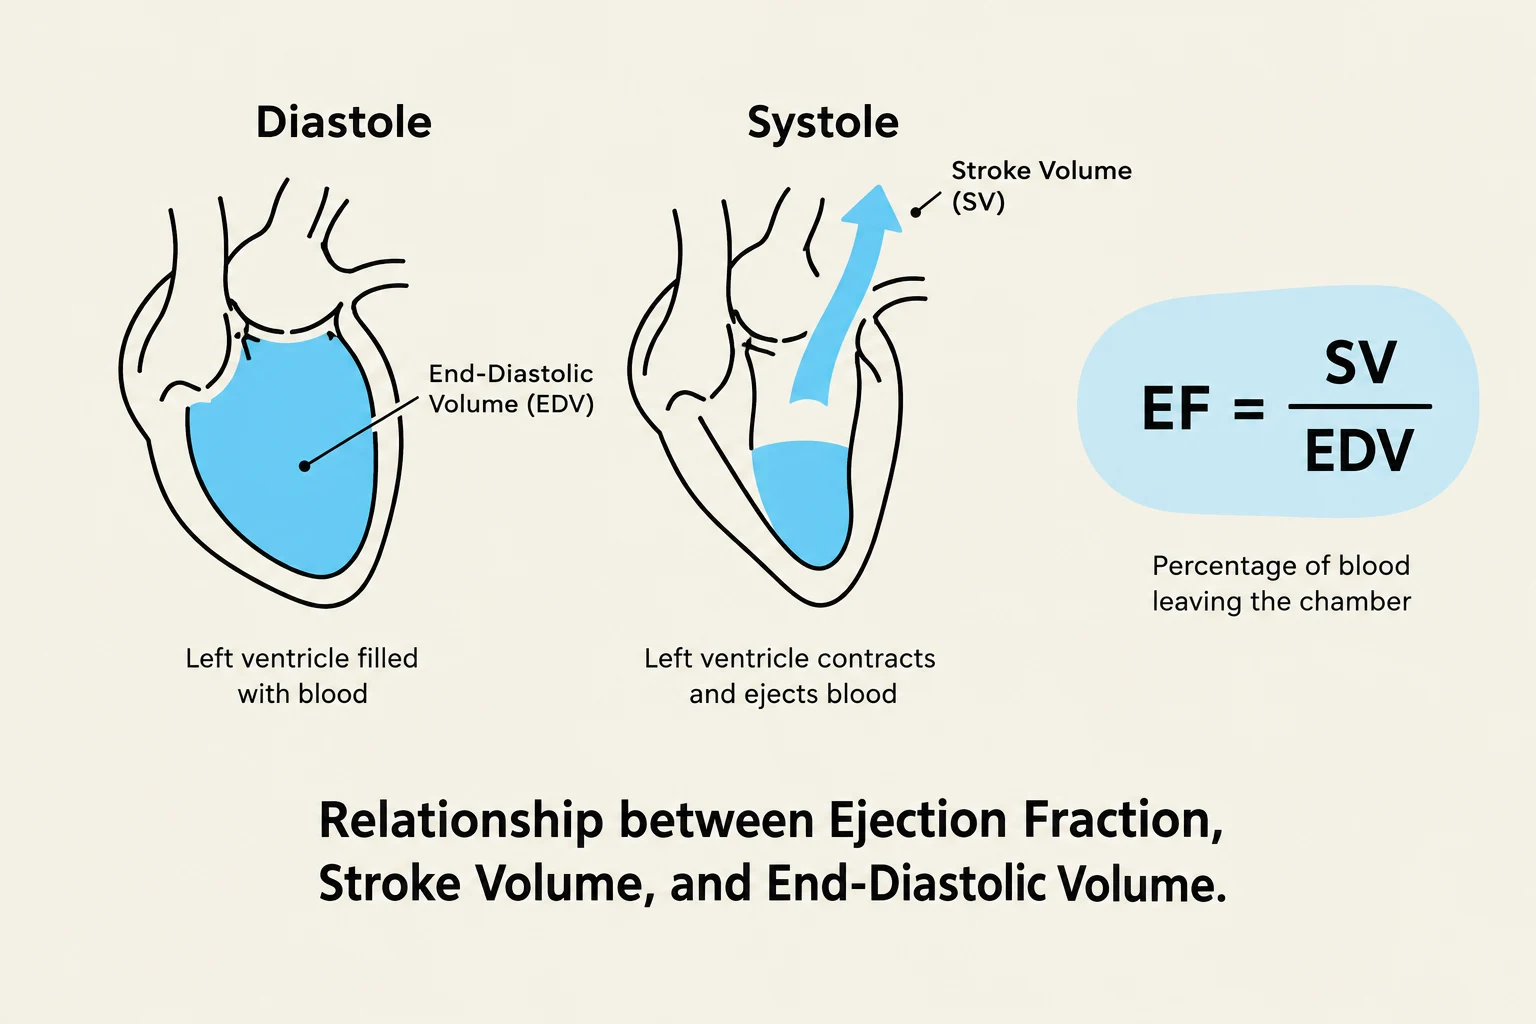
This diagram illustrates the relationship between Ejection Fraction (EF), Stroke Volume (SV), and End-Diastolic Volume (EDV) in the heart. It shows the left ventricle during diastole (filling with blood) and systole (contracting and ejecting blood), along with the formula for calculating EF.
Cardiac Output and Ventricular Function
Cardiac Output (CO) is the volume of blood flowing through either the systemic or the pulmonary circuit per minute. It is a primary indicator of how well the heart is meeting the metabolic demands of the body. CO is determined by two main components: Heart Rate (HR) and Stroke Volume (SV).
The mathematical relationship is expressed as:
CO=HR×SV
Because a person's body size significantly influences how much blood is needed, clinicians use the Cardiac Index (CI) to normalize the cardiac output to the patient's Body Surface Area (BSA):
CI=BSACO
A normal CI typically ranges from 2.5 to 4.0 L/min/m².
To assess how efficiently the ventricles are actually pumping, we look at the Ejection Fraction (EF). This represents the percentage of blood ejected from the ventricle with each contraction. It is calculated by dividing the stroke volume by the End-Diastolic Volume (EDV):
EF=EDVSV
A normal EF is ≥55%. A low EF often indicates impaired ventricular function, such as in heart failure.
Hemodynamics: The Physics of Blood Flow
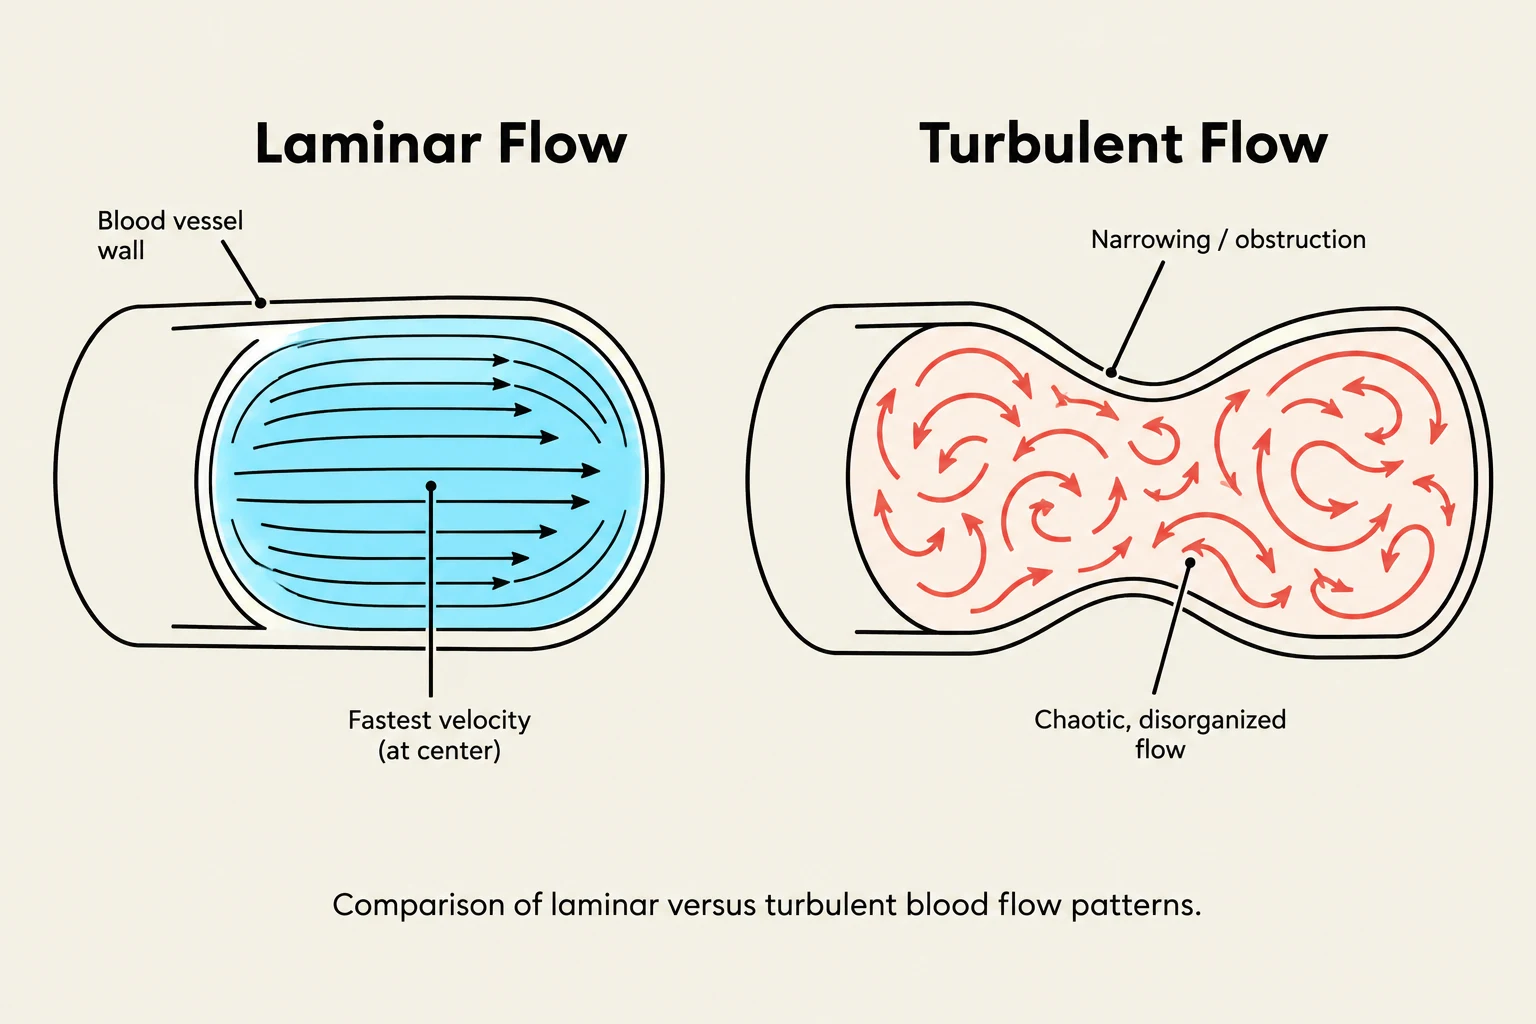
Comparison of laminar versus turbulent blood flow patterns.
Blood flow is not just about the pump; it is governed by the physical properties of the vessels and the blood itself. Several key factors influence how easily blood moves through the system:
Resistance: This is the opposition to blood flow. It is primarily determined by the diameter (radius) and length of the blood vessels.
Viscosity: This refers to the "thickness" of the blood. For example, a high hematocrit (the ratio of red blood cells to total volume) increases viscosity, which in turn increases resistance and slows flow.
Vascular Compliance: This is the ability of a vessel to stretch and accommodate changes in volume. Veins are much more compliant than arteries, meaning they can hold larger volumes of blood with less pressure change.
Velocity: The distance blood travels per unit of time.
Poiseuille’s Law and Flow Patterns
According to Poiseuille’s Law, there is an inverse relationship between resistance and flow: the greater the resistance, the lower the blood flow.
Furthermore, blood flow can be categorized into two patterns:
Laminar Flow: Smooth, streamlined flow where blood moves in concentric layers.
Turbulent Flow: Disorganized, chaotic flow that often occurs when blood encounters obstructions or high velocities, which can be heard as murmurs.
Regulation of Cardiac Output
Cardiac output is regulated by three primary physiological pillars: preload, afterload, and contractility.
1. Preload (The Filling Pressure)
The Frank-Starling Law illustrates the relationship between preload (end-diastolic volume/stretch) and stroke volume, showing that stroke volume increases with preload up to an optimal point, after which excessive stretch reduces output.
Preload is the pressure generated at the end of diastole, often referred to as the "filling pressure". It is determined by the amount of venous return (the blood returning to the heart) and the end-systolic volume.
Measurement:
Right ventricular preload is measured via Central Venous Pressure (CVP) (normal: 3–8 mmHg).
Left ventricular preload is measured via Pulmonary Artery Occlusion Pressure (PAOP), also known as Pulmonary Capillary Wedge Pressure (PCWP) (normal: 2–15 mmHg).
The Frank-Starling Law describes the relationship between preload and output: increased myocardial stretch (due to increased preload) results in a more forceful contraction and a greater stroke volume. However, if preload exceeds the physiological range, excessive stretching can actually cause cardiac output to decline.
2. Afterload (The Resistance to Ejection)
Afterload is the resistance the ventricles must overcome to eject blood during systole.
Measurement:
Left ventricular afterload is often indexed by Systemic Vascular Resistance (SVR).
Right ventricular afterload is measured as Pulmonary Vascular Resistance (PVR).
Increased afterload (caused by vasoconstriction or valvular stenosis) increases the workload of the heart and its oxygen demand.
3. Contractility (The Force of Contraction)
Contractility refers to the inherent strength of the myocardial contraction, independent of preload. This is influenced by the autonomic nervous system and various chemical agents.
Inotropic Agents:
Positive inotropes (e.g., epinephrine, norepinephrine, dopamine, thyroid hormone) increase the force of contraction.
Negative inotropes (e.g., acetylcholine, hypoxia) decrease the force of contraction.
Clinical Note: Electrolytes and Contractility
Potassium levels are critical for contractility. Excess potassium (hyperkalemia) can make the heart dilated and flaccid, slowing the heart rate and decreasing contractility.
Physiological Laws and Reflexes
Two mathematical laws help explain how the heart adapts to pressure and volume changes:
Frank-Starling Law: As mentioned, more stretch during diastole leads to a greater force of contraction and increased stroke volume.
Laplace’s Law: This law states that the contractile force within a chamber depends on the radius of the chamber and the thickness of its wall. In cases of ventricular dilation (increased radius), the force required to maintain pressure increases, which can lessen the available contractile force.
Neural Regulation of Blood Pressure
The body uses rapid-response reflexes to maintain homeostasis:
Baroreceptor Reflex: Located in the arterial walls, these receptors detect changes in blood pressure. If blood pressure falls, the reflex increases heart rate and causes arterioles to constrict to restore pressure.
Bainbridge Reflex: This involves changes in heart rate resulting from increases in venous return (often seen during intravenous infusions).
Summary Table: Hemodynamic Determinants
Factor
Definition
Clinical Measurement/Example
Preload
Filling pressure at end of diastole
CVP (Right), PAOP/PCWP (Left)
Afterload
Resistance to ventricular ejection
SVR (Left), PVR (Right)
Contractility
Force of myocardial contraction
Positive Inotropes (e.g., Epinephrine)
Keep reading for free.
Create an account to finish this reading and make it part of your study routine.