This article explores how to value different types of bonds, how to interpret the yield curve, and how to derive forward rates from market data. It covers zero-coupon bonds, coupon bonds, yield to maturity, holding-period return, and the theories behind the term structure of interest rates.
In the world of fixed-income securities, understanding the relationship between price, interest rates, and time is fundamental. Debt securities promise a stream of income—either fixed or determined by a formula—and their value is driven by the discounting of these expected cash flows. This article explores how to value different types of bonds, how to interpret the yield curve, and how to derive forward rates from market data.
Valuing Bonds: Zero-Coupon and Coupon Bonds
The value of any bond is the present value of its expected future cash flows. The method of calculation depends on the bond's structure.
Zero-Coupon Bonds
A zero-coupon bond does not make periodic interest payments. Instead, it is issued at a discount and pays the full par value (face value) at maturity. The price of a zero-coupon bond is simply the present value of the single payment at maturity.
Coupon Bonds
Most bonds are coupon bonds, which provide regular interest payments (coupons) plus the return of the par value at maturity. To value these, we sum the present value of the coupon annuity and the present value of the par value:
Bond value=Coupon×r1[1−(1+r)T1]+Par value×(1+r)T1
Where r is the discount rate and T is the time to maturity.
Worked Example: Coupon Bond Pricing
What is the value of an 8% semiannual coupon, 30-year maturity bond with a par value of $1,000 if interest rates are 8%?
Since it is semiannual, there are 60 periods (T=60) and the periodic rate is 4% (r=0.04). The coupon payment is $40 (1,000×0.08/2).
The Yield to Maturity is the internal rate of return of a bond. It is the interest rate that equates the present value of all future cash flows to the current market price. It assumes that all coupons are reinvested at that same rate.
Holding-Period Return (HPR)
While YTM is a proxy for the average return if held to maturity, the Holding-Period Return (HPR) measures the actual return over a specific period, which may be shorter than the bond's life.
HPR=Buy PriceSell Price−Buy Price+Coupon(s)
Exam Tip: Remember the inverse relationship between price and yield. When market interest rates rise, bond prices fall, and vice versa.
The Yield Curve: Pure vs. On-the-Run
The yield curve is a graphical representation of the relationship between yield to maturity and time to maturity. Investors use it to gauge market expectations for future interest rates.
There are two primary ways to view the yield curve:
Pure Yield Curve: This refers to the curve constructed from stripped, zero-coupon Treasury securities.
On-the-Run Yield Curve: This refers to the yields of recently issued coupon bonds that are currently trading at or near par value. This is the version most commonly published in financial media.
The shape of the curve can vary: it can be flat, rising (upward sloping), inverted (downward sloping), or hump-shaped. An inverted yield curve is often viewed as a signal of an impending recession.
Spot Rates, Short Rates, and Forward Rates
To analyze the term structure deeply, we must distinguish between different types of interest rates.
Spot Rates and Short Rates
Spot Rate: The yield to maturity of a zero-coupon bond for a specific maturity.
Short Rate: The interest rate applicable to a specific time interval (e.g., a 1-year rate).
Forward Rates
When we move from a world of certainty to one of uncertainty, we use forward rates to describe the interest rate for a future period. A forward rate is essentially a forecast of a future short rate.
The relationship between the spot rate (y) and the forward rate (f) is defined by the following equation:
(1+yn)n=(1+yn−1)n−1×(1+fn)
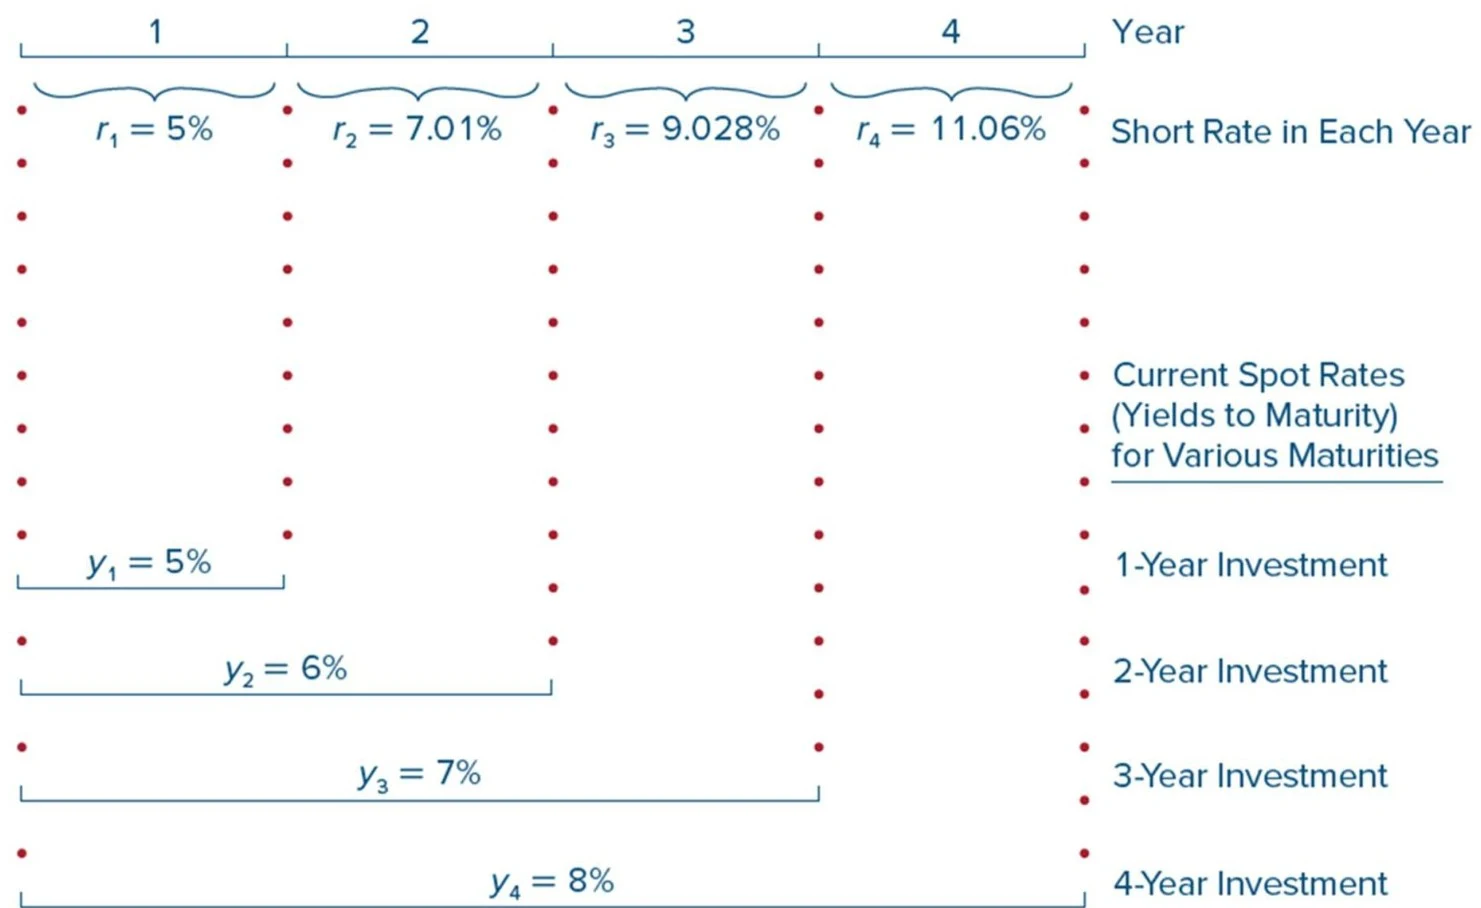
For example, if the 3-year spot rate is 7% and the 4-year spot rate is 8%, the implied forward rate for the fourth year (f4) is:
1+f41+f4f4=(1.07)3(1.08)4=1.1106=11.06%
Theories of the Term Structure
Why does the yield curve take its shape?
Expectations Hypothesis: Suggests that forward rates are simply the market's consensus expectation of future short rates.
Liquidity Preference Theory: Argues that investors demand a "liquidity premium" to hold longer-term bonds because they are riskier. This theory predicts an upward-sloping yield curve even if short rates are expected to remain constant.
Market Segmentation Theory: Suggests that different maturity bonds trade in separate, unconnected markets, and the curve is determined by the supply and demand in each segment.
This illustration compares two investment alternatives over a two-year period. Alternative 1 involves a single 2-year investment. Alternative 2 involves two sequential 1-year investments, with proceeds from the first reinvested in the second.Figure 15.2: Comparing investment programs.
This illustration shows the relationship between short rates and spot rates for various maturities, with examples for 1-year, 2-year, 3-year, and 4-year investments.Figure 15.3: Short Rates Versus Spot Rates.
Keep reading for free.
Create an account to finish this reading and make it part of your study routine.