Understanding ECG Rhythms and Electrical Conduction
This guide explains the fundamental principles of electrocardiograms (ECGs), including the heart's electrical conduction system, waveform anatomy, and methods for measuring heart rates. It details a systematic approach to rhythm determination, crucial for clinical practice.
Understanding the electrocardiogram (ECG) is fundamental to clinical practice. An ECG provides a graphic display of the heart's electrical activity. To interpret these rhythms accurately, one must first understand the underlying physiological process: the heart uses electrical impulses to drive mechanical contractions. This process is characterized by a cycle of depolarization (electrical activation) and repolarization (electrical recovery).
The Cardiac Cycle and the "Atrial Kick"
The heart functions as a pump where electrical signals trigger muscle movement. The atria act as reservoirs for blood returning from the body. As the heart cycles, the initial systole occurs in the atria, causing them to contract and finish filling the ventricles.
While gravity allows the first two-thirds of blood to flow into the ventricles when the AV valves open, the final third is added by the active contraction of the atria. This crucial final step is known as the atrial kick. In rhythms where atrial contraction is lost, such as atrial fibrillation, the patient may lose 25–30% of their cardiac output, which can lead to inadequate tissue perfusion.
Anatomy of an ECG Waveform
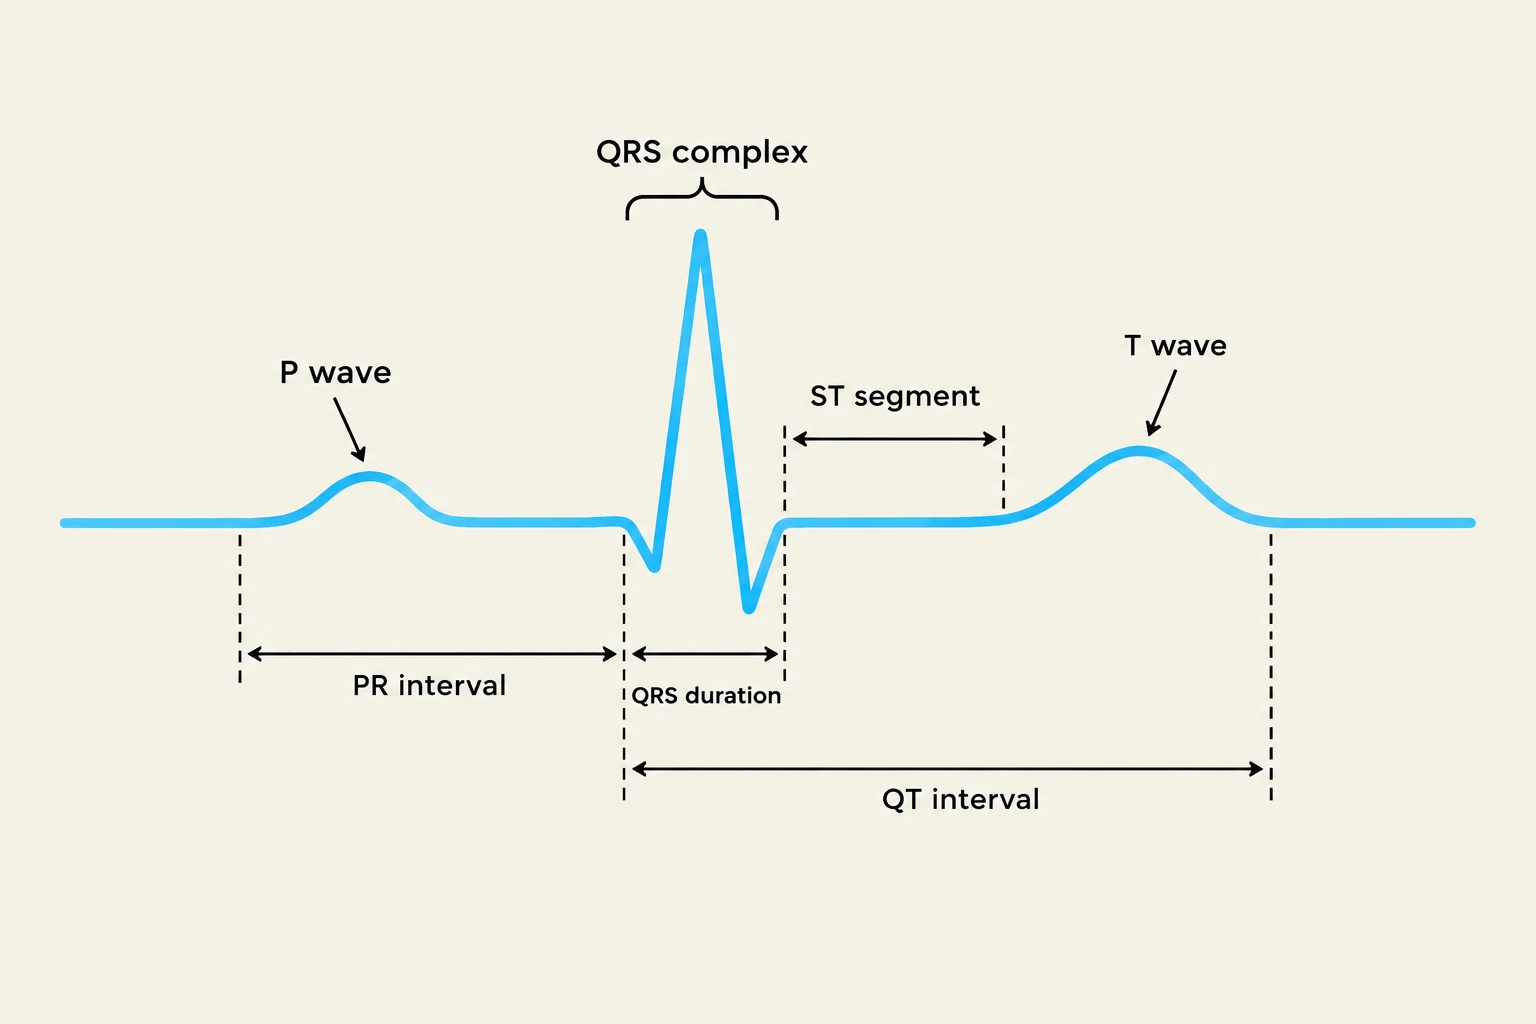
An electrocardiogram (ECG) tracing showing the different waves and intervals: P wave, QRS complex, T wave, PR interval, QRS duration, ST segment, and QT interval.
An ECG trace is composed of specific waveforms and intervals that represent the electrical events of the heart. Each component must be analyzed for its morphology (shape) and timing.
Atrial and Ventricular Activity
P wave: Represents atrial contraction. In a normal sinus rhythm, the P wave should be symmetrical, upright in Lead II, and there should be exactly one P wave for every QRS complex.
QRS complex: Represents ventricular contraction. A normal QRS duration is typically between 0.04 and 0.12 seconds (1–3 small boxes).
T wave: Represents ventricular repolarization.
Intervals and Segments
PR interval: Measured from the start of the P wave to the start of the QRS complex. It represents the normal delay in conduction through the AV node. A normal PR interval is 0.12 to 0.20 seconds (3–5 small boxes).
ST segment: The interval from the end of the QRS to the start of the T wave. This segment is clinically vital; elevation or depression can be critical indicators of cardiac ischemia or myocardial infarction (MI).
QT interval: Measured from the beginning of the QRS complex to the end of the T wave. This interval is rate-dependent and is clinically significant when monitoring certain medications.
U wave: An additional wave that may sometimes be seen following the T wave.
Exam Tip: Abnormalities in these components often point to specific pathologies. For example, abnormal P waves suggest atrial dysrhythmias, abnormal QRS complexes suggest ventricular dysrhythmias, and abnormal PR intervals often indicate Heart Block.
Measuring Heart Rates
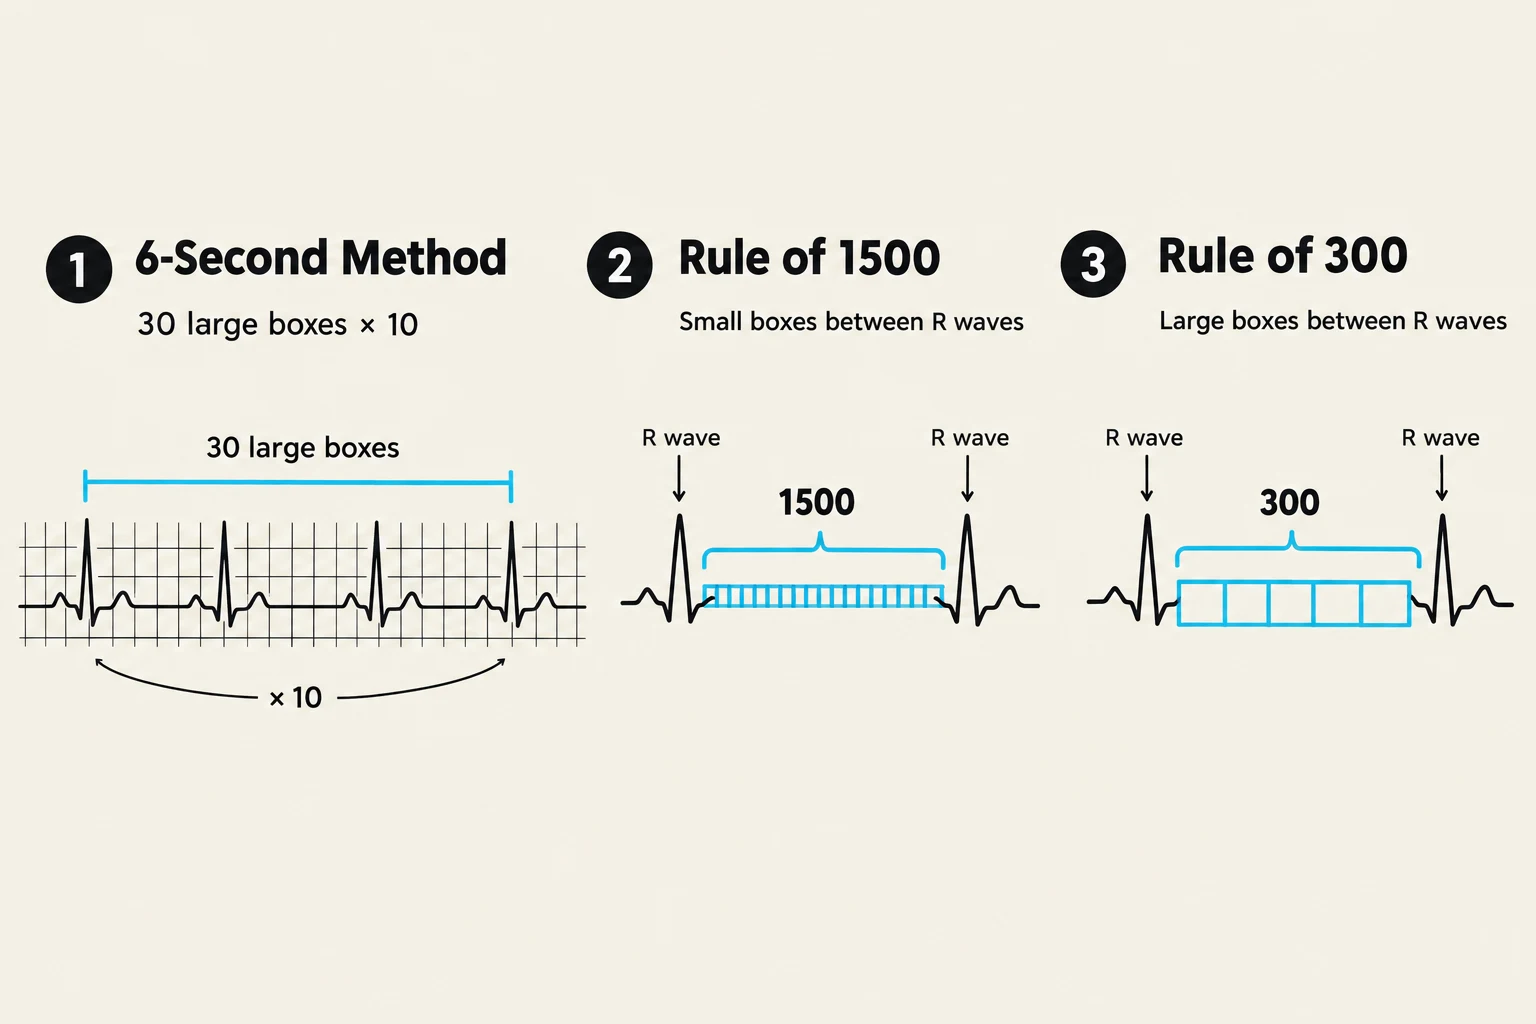
This illustration demonstrates three methods for calculating heart rate from an electrocardiogram (ECG): the 6-second method, the Rule of 1500 (using small boxes), and the Rule of 300 (using large boxes).
To interpret a rhythm, you must calculate both the atrial and ventricular rates. There are three primary methods used to determine the rate:
1. The 6-Second Method
This is a highly reliable method for irregular rhythms.
Locate a 6-second strip on the ECG.
Count the number of QRS complexes within those 6 seconds to find the ventricular rate.
Count the number of P waves within those 6 seconds to find the atrial rate.
Multiply the total count by 10 to get the beats per minute (bpm).
Example: If you count 13 QRS complexes in 6 seconds, the rate is 13×10=130 bpm.
2. The Rule of 1500
This method is used for regular rhythms and provides high precision by utilizing small boxes.
Count the number of small boxes between two consecutive R waves.
Divide 1500 by that number.
Rate=number of small boxes1500
3. The Rule of 300
This is a quicker, "eyeball" method using large boxes.
Count the number of large boxes between two consecutive R waves.
Divide 300 by that number.
Rate=number of large boxes300
Systematic Rhythm Determination
Rather than guessing, clinicians use a 10-step method to reach a clinical interpretation:
Identify Waveforms: Assess the morphology and location of P waves, QRS complexes, and T waves.
Count Atrial Rate: Determine how many P waves occur per minute.
Count Ventricular Rate: Determine the number of QRS complexes per minute.
Assess Atrial Regularity: Is the atrial rhythm regular or irregular?
Assess Ventricular Regularity: Is the ventricular rhythm regular or irregular?
Check P-wave Relationship: Is there a P wave in front of every QRS complex?
Evaluate PR Interval: Is it within the 0.12–0.20 second range?
Evaluate QRS Interval: Is it within the 0.04–0.12 second range?
Analyze ST Segment: Is there elevation, depression, or is it isoelectric?
Interpretation: Determine the clinical significance and required interventions.
By following this systematic approach, you can differentiate between Normal Sinus Rhythm (NSR), where the rate is 60–100 bpm and all components are normal, and more dangerous rhythms like Ventricular Fibrillation or Third-degree Heart Block.
Keep reading for free.
Create an account to finish this reading and make it part of your study routine.