Analyzing International Income Statements: Global Cycles and Growth
Learn how to analyze international income statements by accounting for diverse economic cycles, varying growth patterns, and fluctuating exchange rates to assess multinational enterprise profitability.
When a company operates across borders, its income statement becomes significantly more complex than a domestic-only report. Instead of simply tracking sales and costs in a single currency and economic environment, international managers must account for a mosaic of different economic cycles, varying growth patterns, and fluctuating exchange rates. Understanding how these external forces impact the bottom line is essential for assessing the true profitability and sustainability of a multinational enterprise (MNE).
The Complexity of Global Revenue Streams
In a domestic setting, revenue is largely driven by local consumer demand and the domestic business cycle. However, for an international firm, revenue is a function of both local market demand and the strength of the foreign currency relative to the home currency.
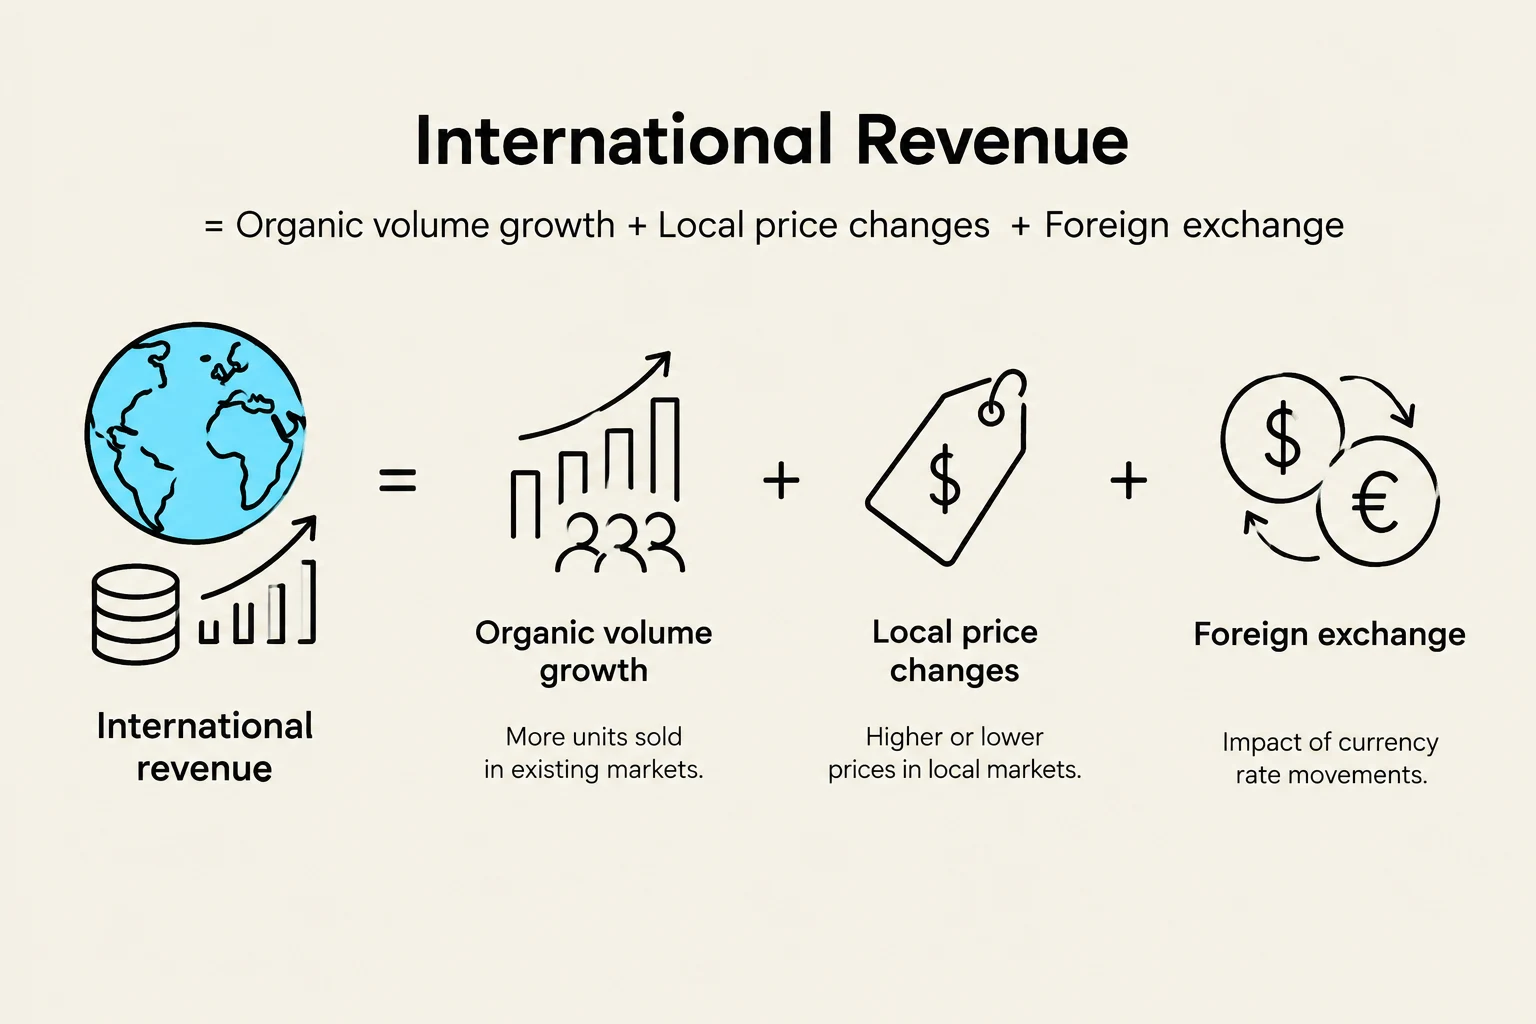
When analyzing international revenues, analysts must distinguish between "organic growth" (growth driven by increased volume or price increases in the local market) and "currency-driven growth" (increases in reported revenue caused by a strengthening foreign currency). For example, if a US-based company sells goods in Europe, a surge in Euro value against the US Dollar will inflate the reported revenue in USD, even if the actual number of units sold in Europe remained stagnant.
International revenue is composed of organic volume growth, local price changes, and foreign exchange impacts.
Exam Tip: When asked to evaluate the performance of a multinational, always look for "constant currency" metrics. This allows you to see how the business is actually performing without the "noise" of exchange rate volatility.
Economic Cycles and Market Divergence
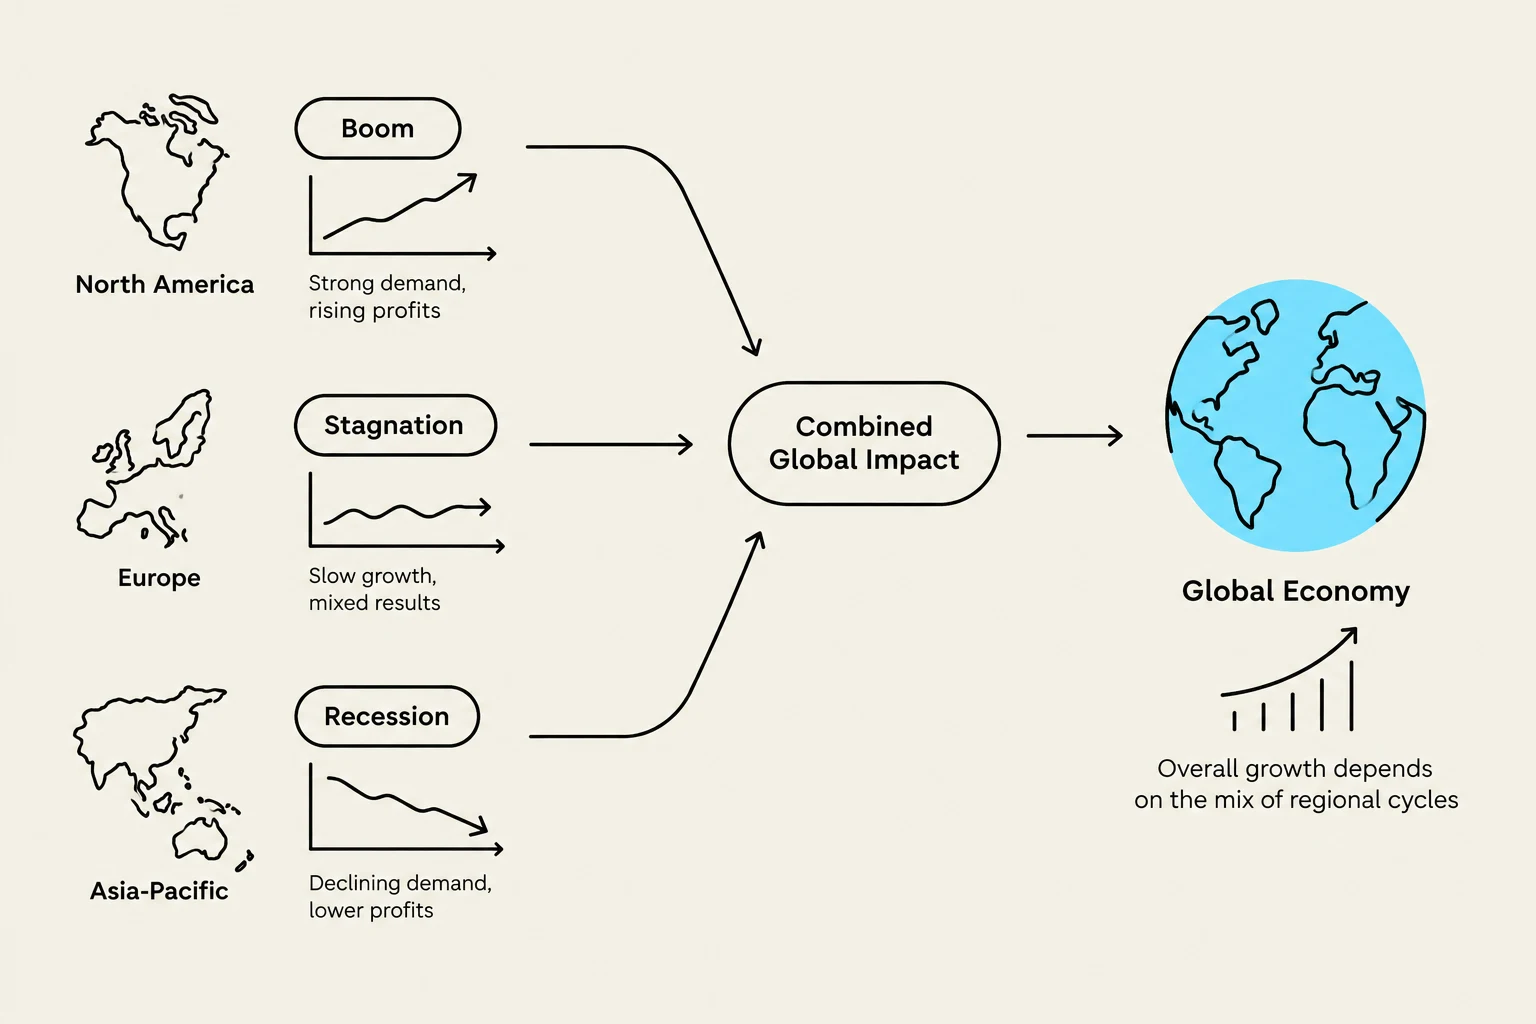
One of the most challenging aspects of international financial analysis is the lack of synchronization between global markets. While one region may be experiencing an economic boom, another may be in a recession. This divergence creates a "natural hedge" or a "compounding risk" depending on the company's geographic footprint.
1. Pro-cyclical vs. Counter-cyclical Markets
Some markets are highly sensitive to the global credit cycle. If a company's revenue is concentrated in emerging markets that are highly sensitive to interest rate hikes, their income statement will show high volatility. Conversely, if a company operates in "defensive" sectors (like consumer staples) across diverse markets, the different economic cycles may smooth out the total consolidated income statement.
2. Growth Patterns: Mature vs. Emerging
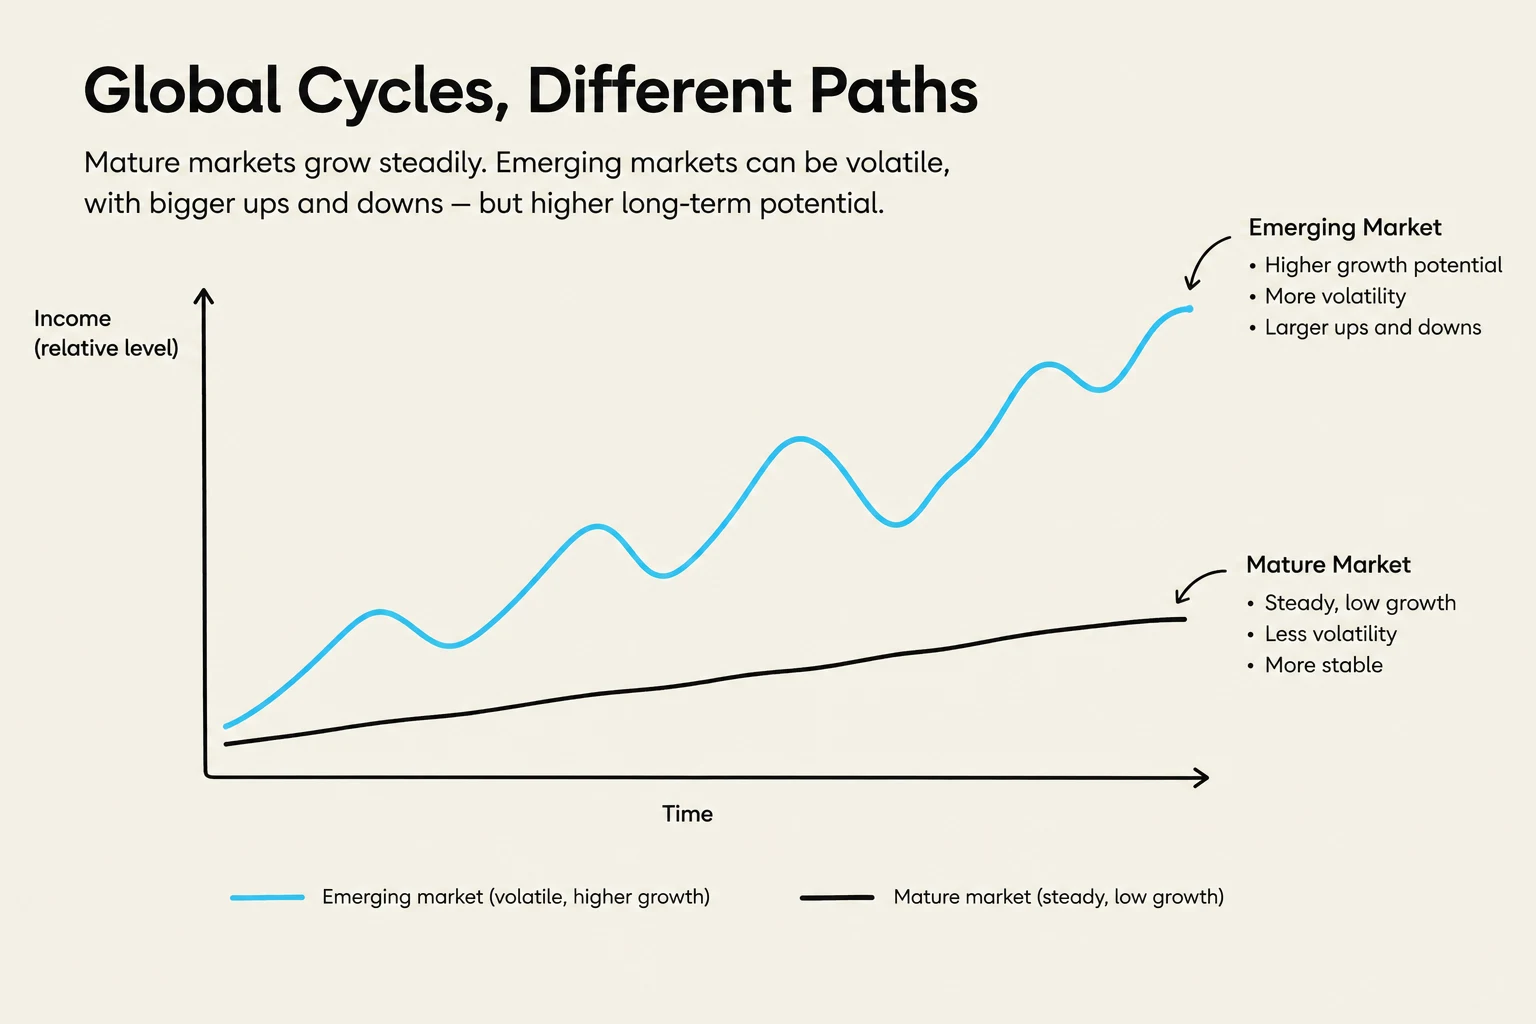
Growth patterns vary significantly by region. Mature markets (like Western Europe or North America) often exhibit low, stable growth rates, whereas emerging markets (like parts of Southeast Asia or Latin America) may show high, volatile growth.
The mathematical relationship between these growth rates and the total consolidated growth can be expressed as a weighted average:
Gtotal=i=1∑n(wi⋅gi)
Where:
Gtotal is the total consolidated growth rate.
wi is the weight of market i in the total revenue mix.
gi is the growth rate of market i.
This diagram illustrates how economic conditions in different regions, such as North America (boom), Europe (stagnation), and Asia-Pacific (recession), combine to influence the overall global economy. The final outcome for global growth is shown to depend on the mix of these regional economic cycles.
Expense Management and Cost Structures
While revenue is influenced by market demand, expenses in an international income statement are heavily influenced by local inflation rates, labor laws, and supply chain logistics.
Local vs. Global Costs
Multinationals typically face two types of expenses:
Local Operating Expenses (OPEX): These include wages, rent, and local marketing. These are highly sensitive to the local inflation rate and the local economic cycle.
Global Costs of Goods Sold (COGS): If a company sources raw materials globally, its COGS may be subject to international commodity price swings and shipping costs, which may not correlate with the economic cycle of the market where the final product is sold.
The Impact of Inflationary Divergence
If a company's revenue is earned in a country with high inflation, but its costs are incurred in a country with low inflation, the margins may appear to expand in nominal terms. However, an analyst must determine if this is a sustainable competitive advantage or merely a temporary accounting effect caused by the timing of cost recognition and currency translation.
Worked Example: The Impact of Divergent Cycles
Consider GlobalTech Corp, a company with two main segments:
Segment
Market Type
Revenue Share
Local Growth Rate
Segment A (Europe)
Mature
60%
2%
Segment B (Emerging Asia)
Emerging
40%
12%
Scenario 1: Synchronized Growth
If both markets grow at their expected rates, the consolidated growth is:
GtotalGtotalGtotal=(0.60⋅0.02)+(0.40⋅0.12)=0.012+0.048=0.06 or 6%
Scenario 2: Economic Divergence (Recession in Asia)
If an economic downturn hits Emerging Asia, causing its growth to drop to -5%, while Europe remains stable:
GtotalGtotalGtotal=(0.60⋅0.02)+(0.40⋅−0.05)=0.012−0.02=−0.008 or −0.8%
This example demonstrates how a significant downturn in a high-growth market can completely offset the stability of a mature market, leading to negative consolidated growth.
This graph illustrates the differing growth paths of emerging and mature markets over time, highlighting volatility and potential.
Summary for Analysts
To effectively analyze international income statements, one must look beyond the headline numbers. An analyst should:
Decompose revenue into organic growth and currency effects.
Evaluate the geographic mix to understand exposure to different economic cycles.
Assess the correlation between revenue markets and cost markets to identify potential natural hedges.
Adjust for inflation to ensure that margin expansions are not merely illusions created by local price volatility.
Keep reading for free.
Create an account to finish this reading and make it part of your study routine.