Analysis of Nonlinear Systems using Phase Plane and Describing Function Methods
This content explains the phase plane method and the describing function method for analyzing nonlinear systems, including mathematical formulations and common nonlinearities like relay, dead zone, and saturation.
In the study of control systems, most classical theories are built upon the foundation of linearity. However, real-world physical systems often exhibit behaviors that cannot be captured by linear models. These phenomena include jump resonance, limit cycles, and frequency entrainment. To analyze these complex behaviors, engineers rely on two primary, complementary approximation methods: the phase plane method and the describing function method.
The Phase Plane Method
The phase plane method is a graphical approach used to determine the transient behavior and stability of a system by constructing phase trajectories. By plotting the state variables against one another, engineers can visually observe how a system evolves over time toward a steady state or an oscillation.
However, this method has a significant limitation: it is primarily restricted to second-order systems. If a researcher needs to investigate a higher-order system, they must first approximate it using a second-order equivalent. A key characteristic of the phase plane method is that it retains the exact nonlinearity of the system while approximating the linear part.
The Describing Function Method
While the phase plane method works in the time domain, the describing function method is a frequency-domain approach based on the principle of harmonic linearization.
Unlike the phase plane method, the describing function method retains the linear part of the system and approximates the nonlinearity. This method relies on a specific assumption: if the linear elements of the system possess low-pass characteristics, they will filter out the higher-order harmonics produced by the nonlinearity. Consequently, the system's response is dominated by the fundamental frequency component.
Mathematical Formulation
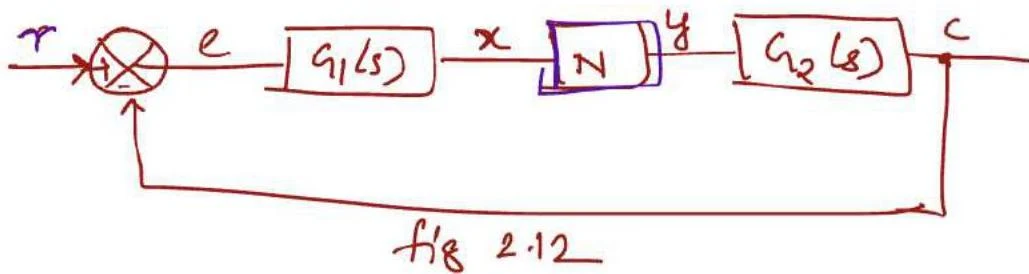
Consider a nonlinear system where the input to the nonlinear element N is a sinusoid x=Xsinωt. The output y of this nonlinear element is generally a non-sinusoidal periodic function. Using a Fourier series, we can represent this output as a sum of various harmonic components:
y=1A0+A1sinωt+B1cosωt+A2sin2ωt+B2cos2ωt+…
Because of the low-pass filtering effect mentioned earlier, we focus only on the fundamental component:
y1=A1sinωt+B1cosωt=γ1sin(ωt+ϕ1)
To find the coefficients of this fundamental component, we use the following integrals:
A1=π2∫0πysinωtd(ωt)B1=π2∫0πycosωtd(ωt)
From these, we calculate the fundamental amplitude (γ1) and the fundamental phase shift (ϕ1):
γ1=A12+B12ϕ1=tan−1A1B1
The describing function, denoted as kN(x,ω), represents the nonlinear element by relating the input amplitude x to the output fundamental amplitude and phase:
kN(x,ω)=xγ1∠ϕ1
A block diagram illustrating a control system with components G1(s), N, and G2(s), and signals r, e, x, y, and c.
By replacing the nonlinear block with its describing function, as shown in Figure 2.13, engineers can apply standard linear frequency-domain techniques for stability analysis.
Exam Tip: Remember that the describing function is used for stability analysis, not for direct system design optimization. There is no general correlation between time and frequency responses in nonlinear systems.
Common Nonlinearities
Engineers frequently encounter specific types of nonlinearities that can be analyzed using the describing function method.
1. Relay Nonlinearity
A relay is a common nonlinearity where the output switches between two fixed levels. For a relay with magnitude m, the describing function is derived as:
kN(x,ω)=πx4m∠−π
(Note: The phase shift is typically −π or 180∘ for a standard relay).
2. Dead Zone Nonlinearity
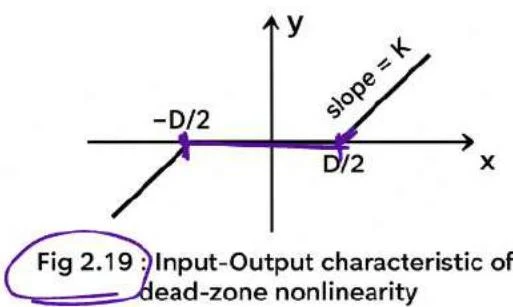
In a dead zone, the output remains zero until the input exceeds a certain threshold (D/2).
A graph illustrating the input-output characteristic of a dead-zone nonlinearity, showing a region where the output is zero for a range of inputs, and linear behavior outside this range.
The describing function for a dead zone is given by:
kN(x,ω)=k1−π2sin−12xD+2xD1−(2xD)2∠0∘
3. Saturation Nonlinearity
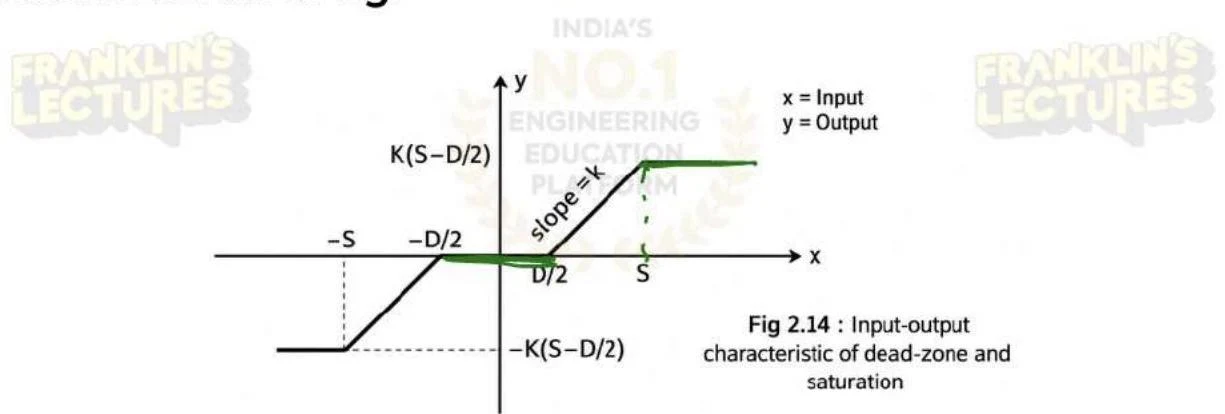
Saturation occurs when the output reaches a maximum limit (S) even if the input continues to increase.
Input-output characteristic of dead-zone and saturation.
The describing function for saturation is:
kN(x,ω)=π2ksin−1(xS)+xS−1−(xS)2∠0∘
Summary Comparison
Feature
Phase Plane Method
Describing Function Method
Domain
Time Domain
Frequency Domain
Approximation
Approximates Linear Part
Approximates Nonlinear Part
Complexity
Restricted to 2nd Order
Applicable to higher-order (via filtering)
Primary Use
Transient behavior & Stability
Stability Analysis
Keep reading for free.
Create an account to finish this reading and make it part of your study routine.